
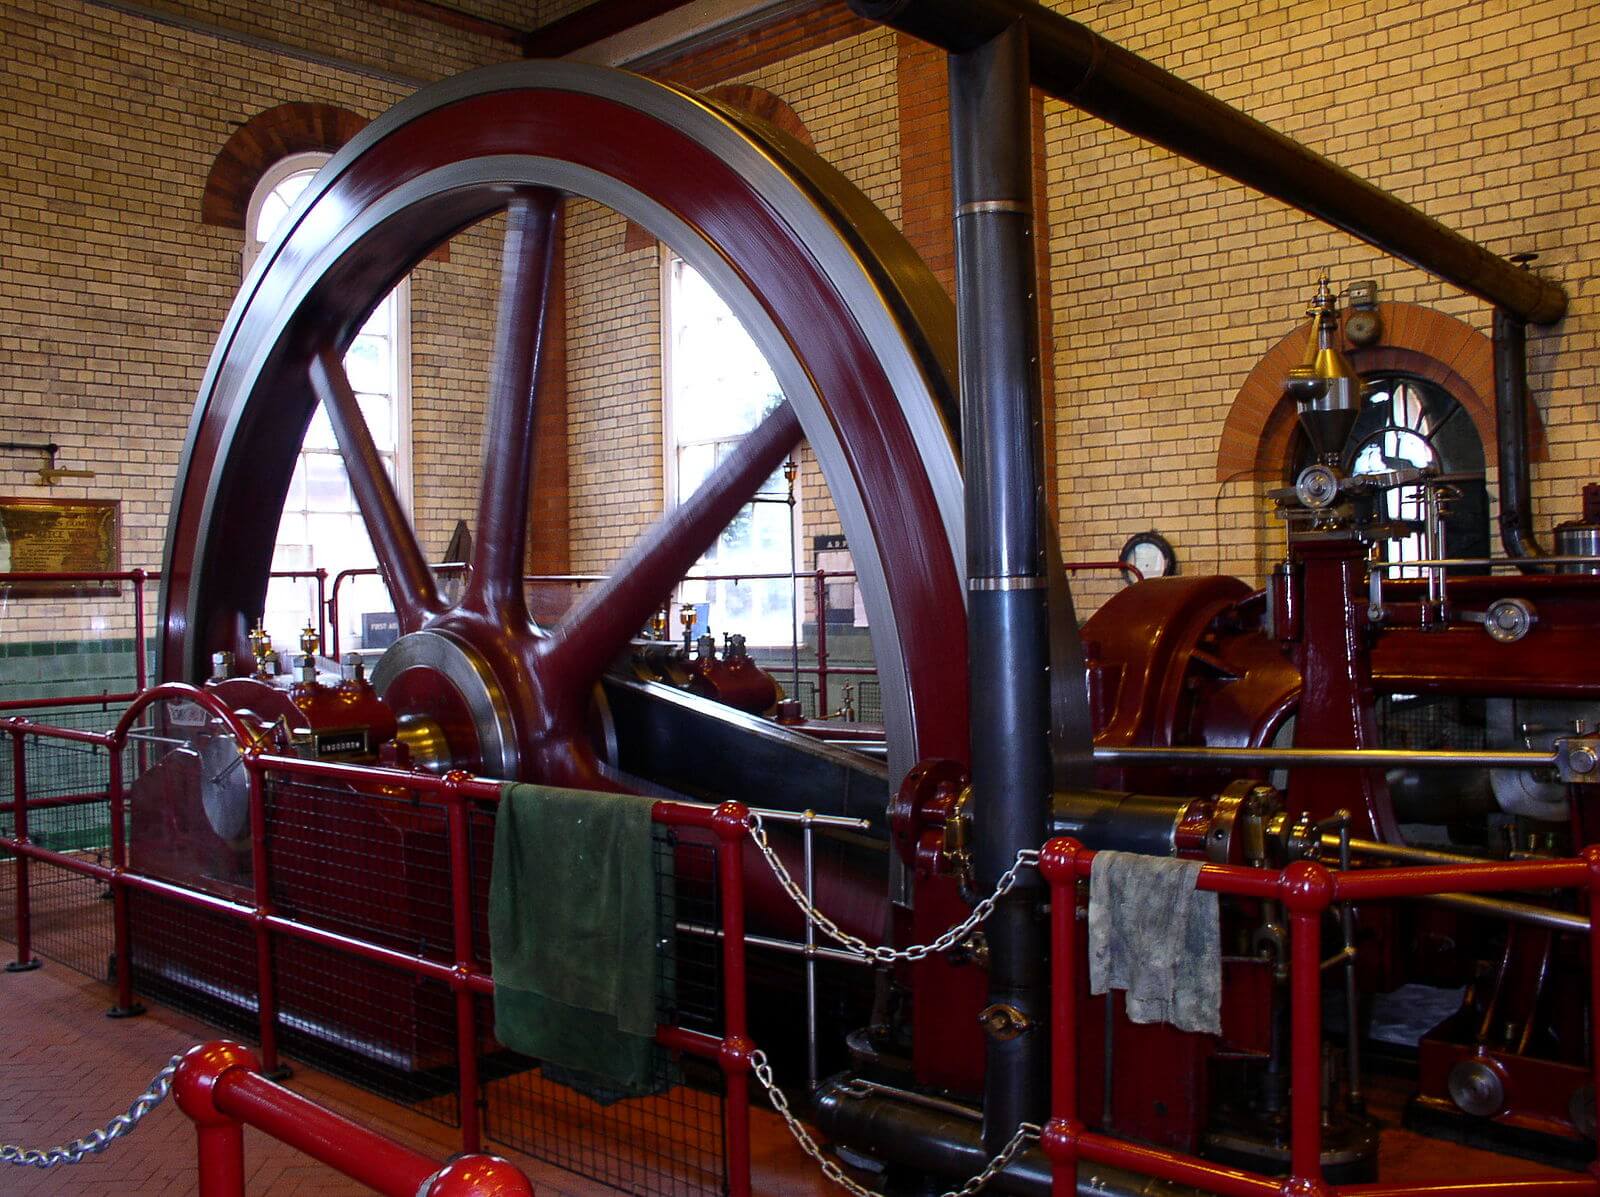
Most of us know this flywheel has been used to power energy output (steam, water, etc) from the industrial revolution, maybe earlier. The concept of a flywheel to help deliver energy to a machine (steam train, windmill, turbine, etc) is part of history and science lessons at school.
Yet it has a place in the minds of the information architects in the age of Google and the rotational force of search engine algorithms. Lets unpack what we see here for content optimization and audience engagement.
In July 2020, we re-archictected Help.Sellercloud.com and after several months compared the post go live Google Analytics stats for the past 3 months versus the previous period. There are some impressive stats worth noting.
1. Bounce rate has fallen 5%
2. Pages viewed per session is up 25% (that’s 1 in 4 visitors viewing an extra page on average)
3. Each user is staying on the site for 1 whole extra minute (up 37%)
If you take the total number of users (12,303) and multiply it by 1 min, you get an extra 205 extra hours that users were on the site. So what were they doing?
For many clients, we calculate branding and engagement this way. Google like to see increased engagement and this gets rewarded with higher rankings for all pages.