Our mission at SearchForecast is to create drive traffic to clients websites, apps and social media points of presence.
We create smarter content ideas through a combination of research of analytics of user traffic to websites. Our design is underpinned by rigorous quantitative analysis of Google Analytics and market data. We do not engage in fanciful handwaving of ideas with our morning coffee. We have a deterministic process that is underpinned by 15 years of optimizing traffic for hundreds of global clients.
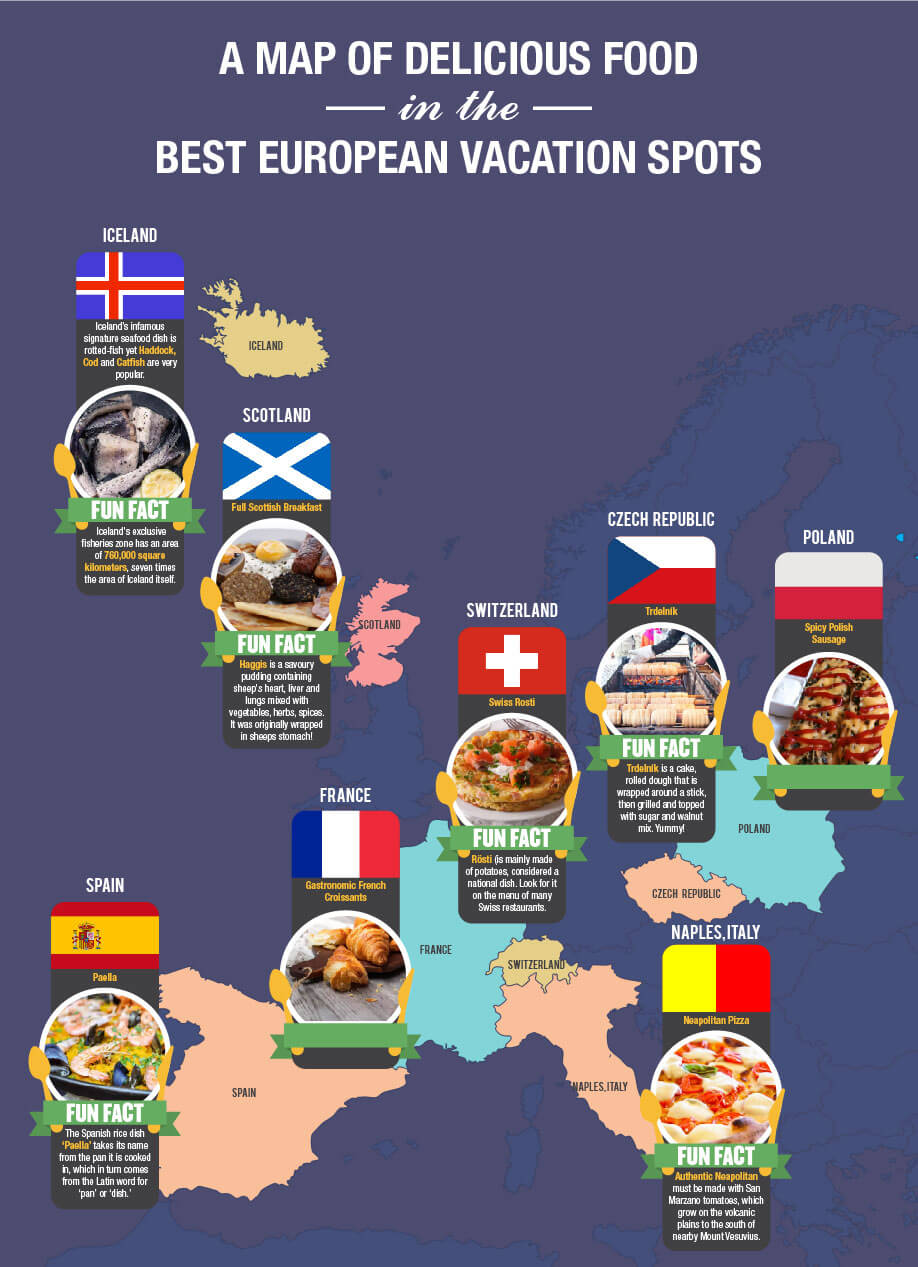
An Infographic is a manifestation of data visualization. It embodies data analytics, stories and design to create a visually compelling image to convey information that is insightful and sharable. Here are several examples of our recent work: