Lockdown Tips for Audiences

Covid is giving us more time to do many more things. Now we’re not commuting, entertaining or hanging out at conferences, we’re pouring over more of the features inside dashboards that drive customers to our clients websites. One simple suggestion for online traffic optimization experts is to create Audiences inside Google Analytics and then target those audiences inside Google Ads to create more targeted audiences seeing more focused ads.

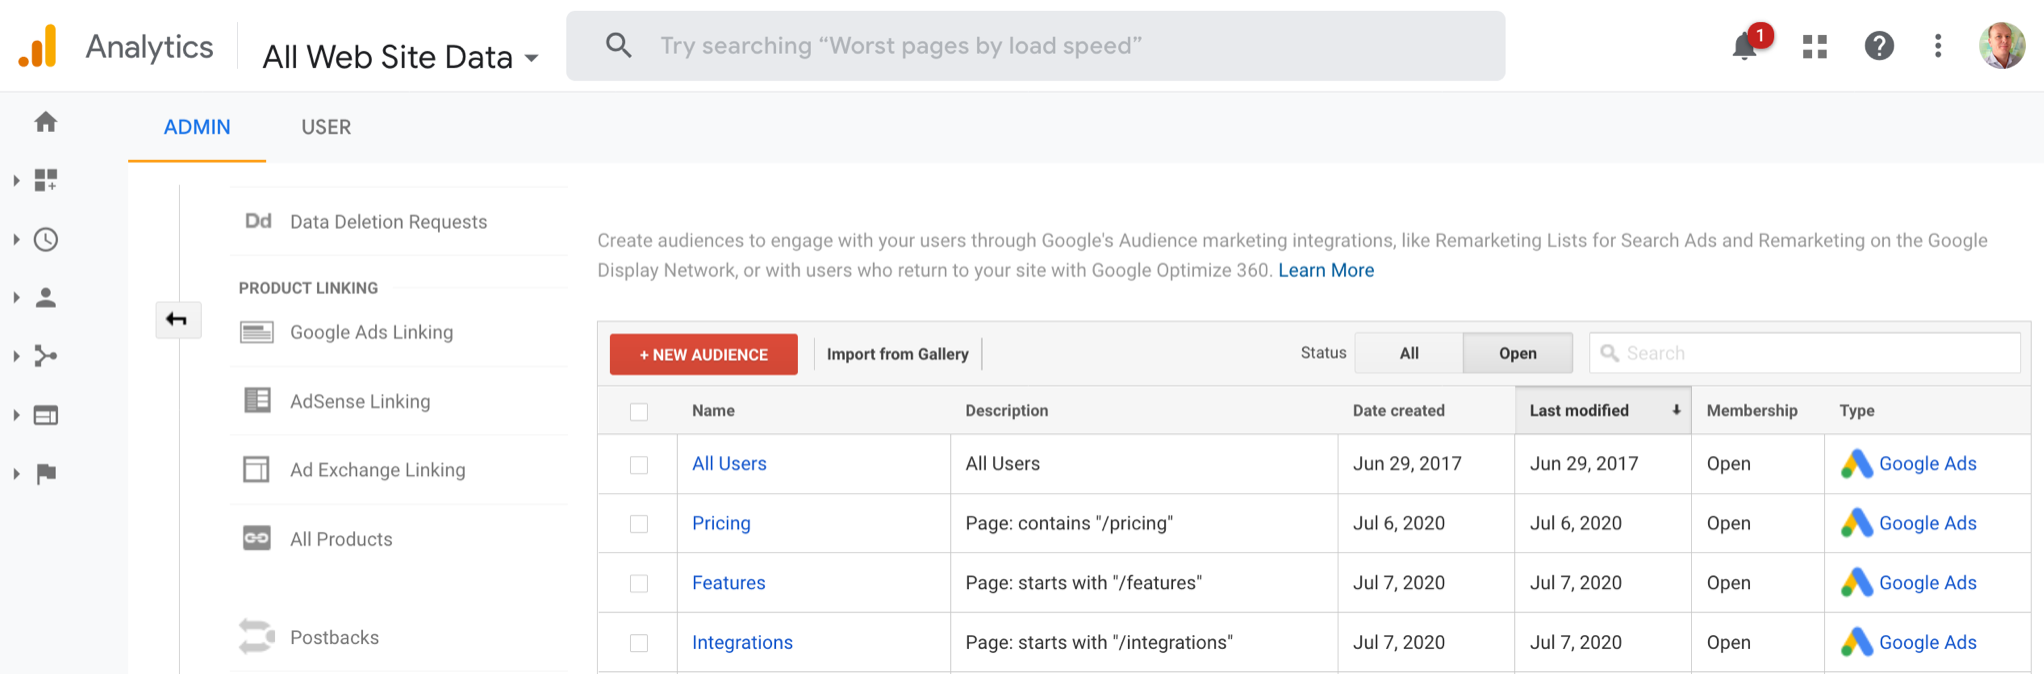
Here’s an example for one of our software clients. You can see audiences were created for key sections of their website (pricing page, features pages and integrations pages). You can create Audiences in the Google Analytics > Admin > Property section (click on the menu ‘Audience Definitions > Audiences) and then create them using the URL string for each section of the site you wish to segment an audience for. You can select Google Ads as were you want the Audience to be imported to.

Screen Shot 2020-08-16 at 12.12.11 AM

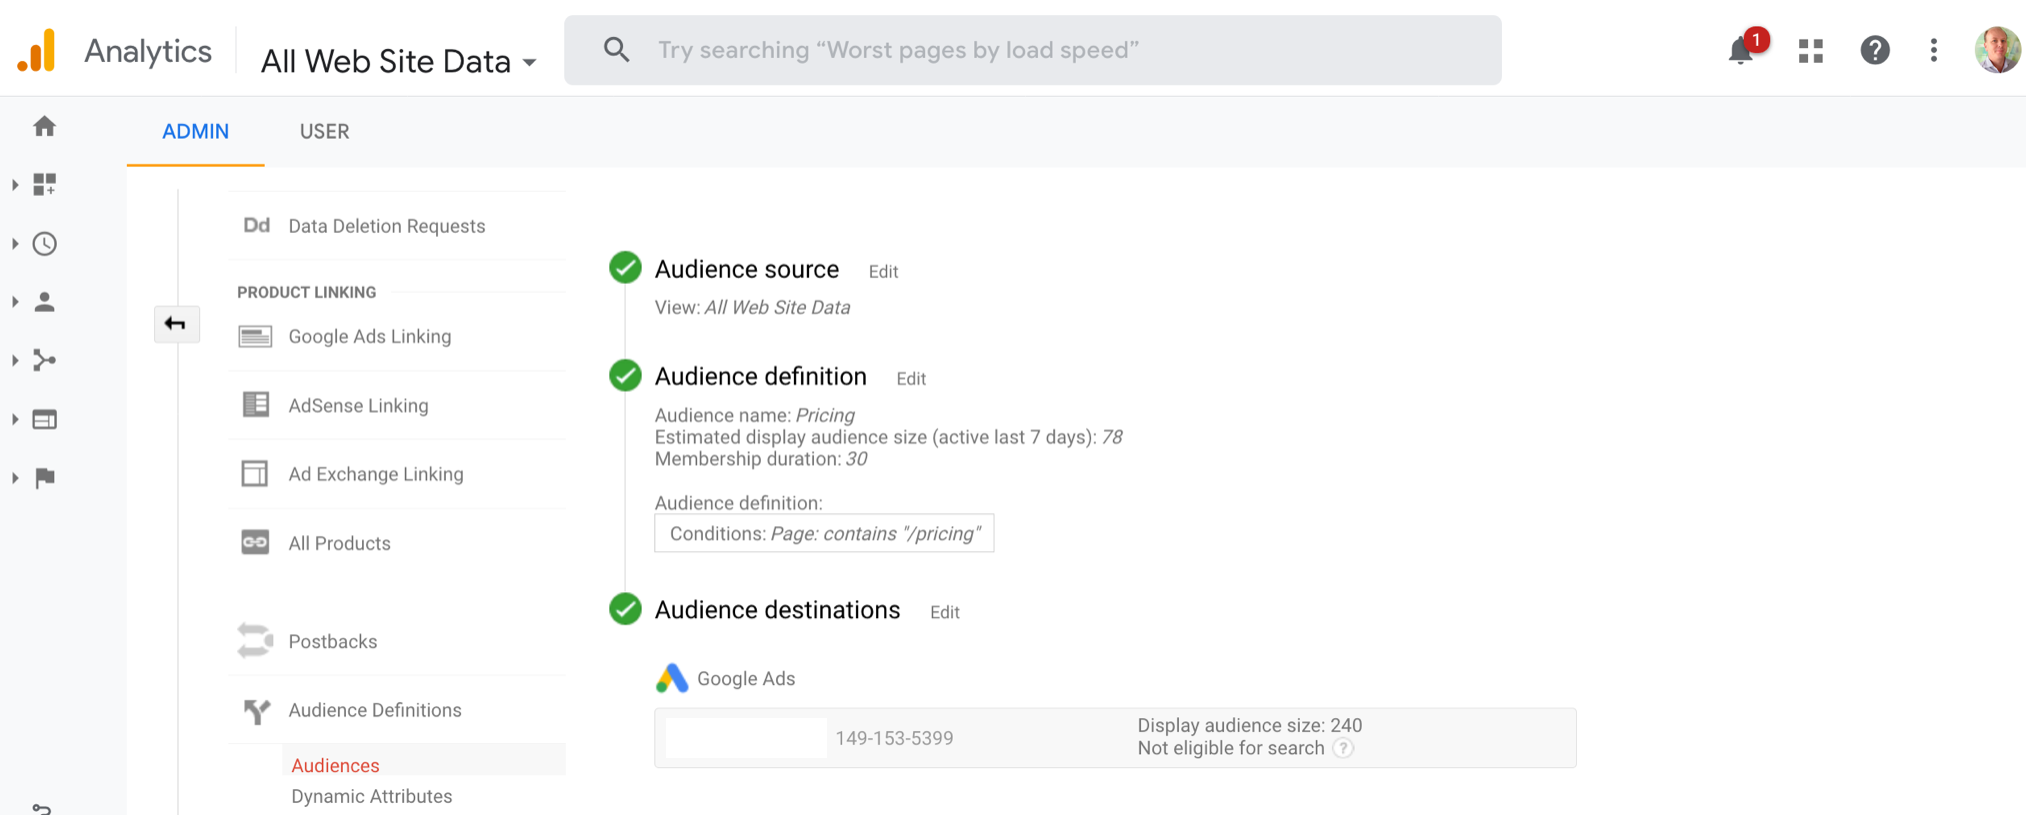
Over time, Google will keep count of the visitors to those section/s of the website and when there is enough traffic, they will publish the audience number. You can see below the Display Audience is 240.

Screen Shot 2020-08-16 at 12.19.25 AM

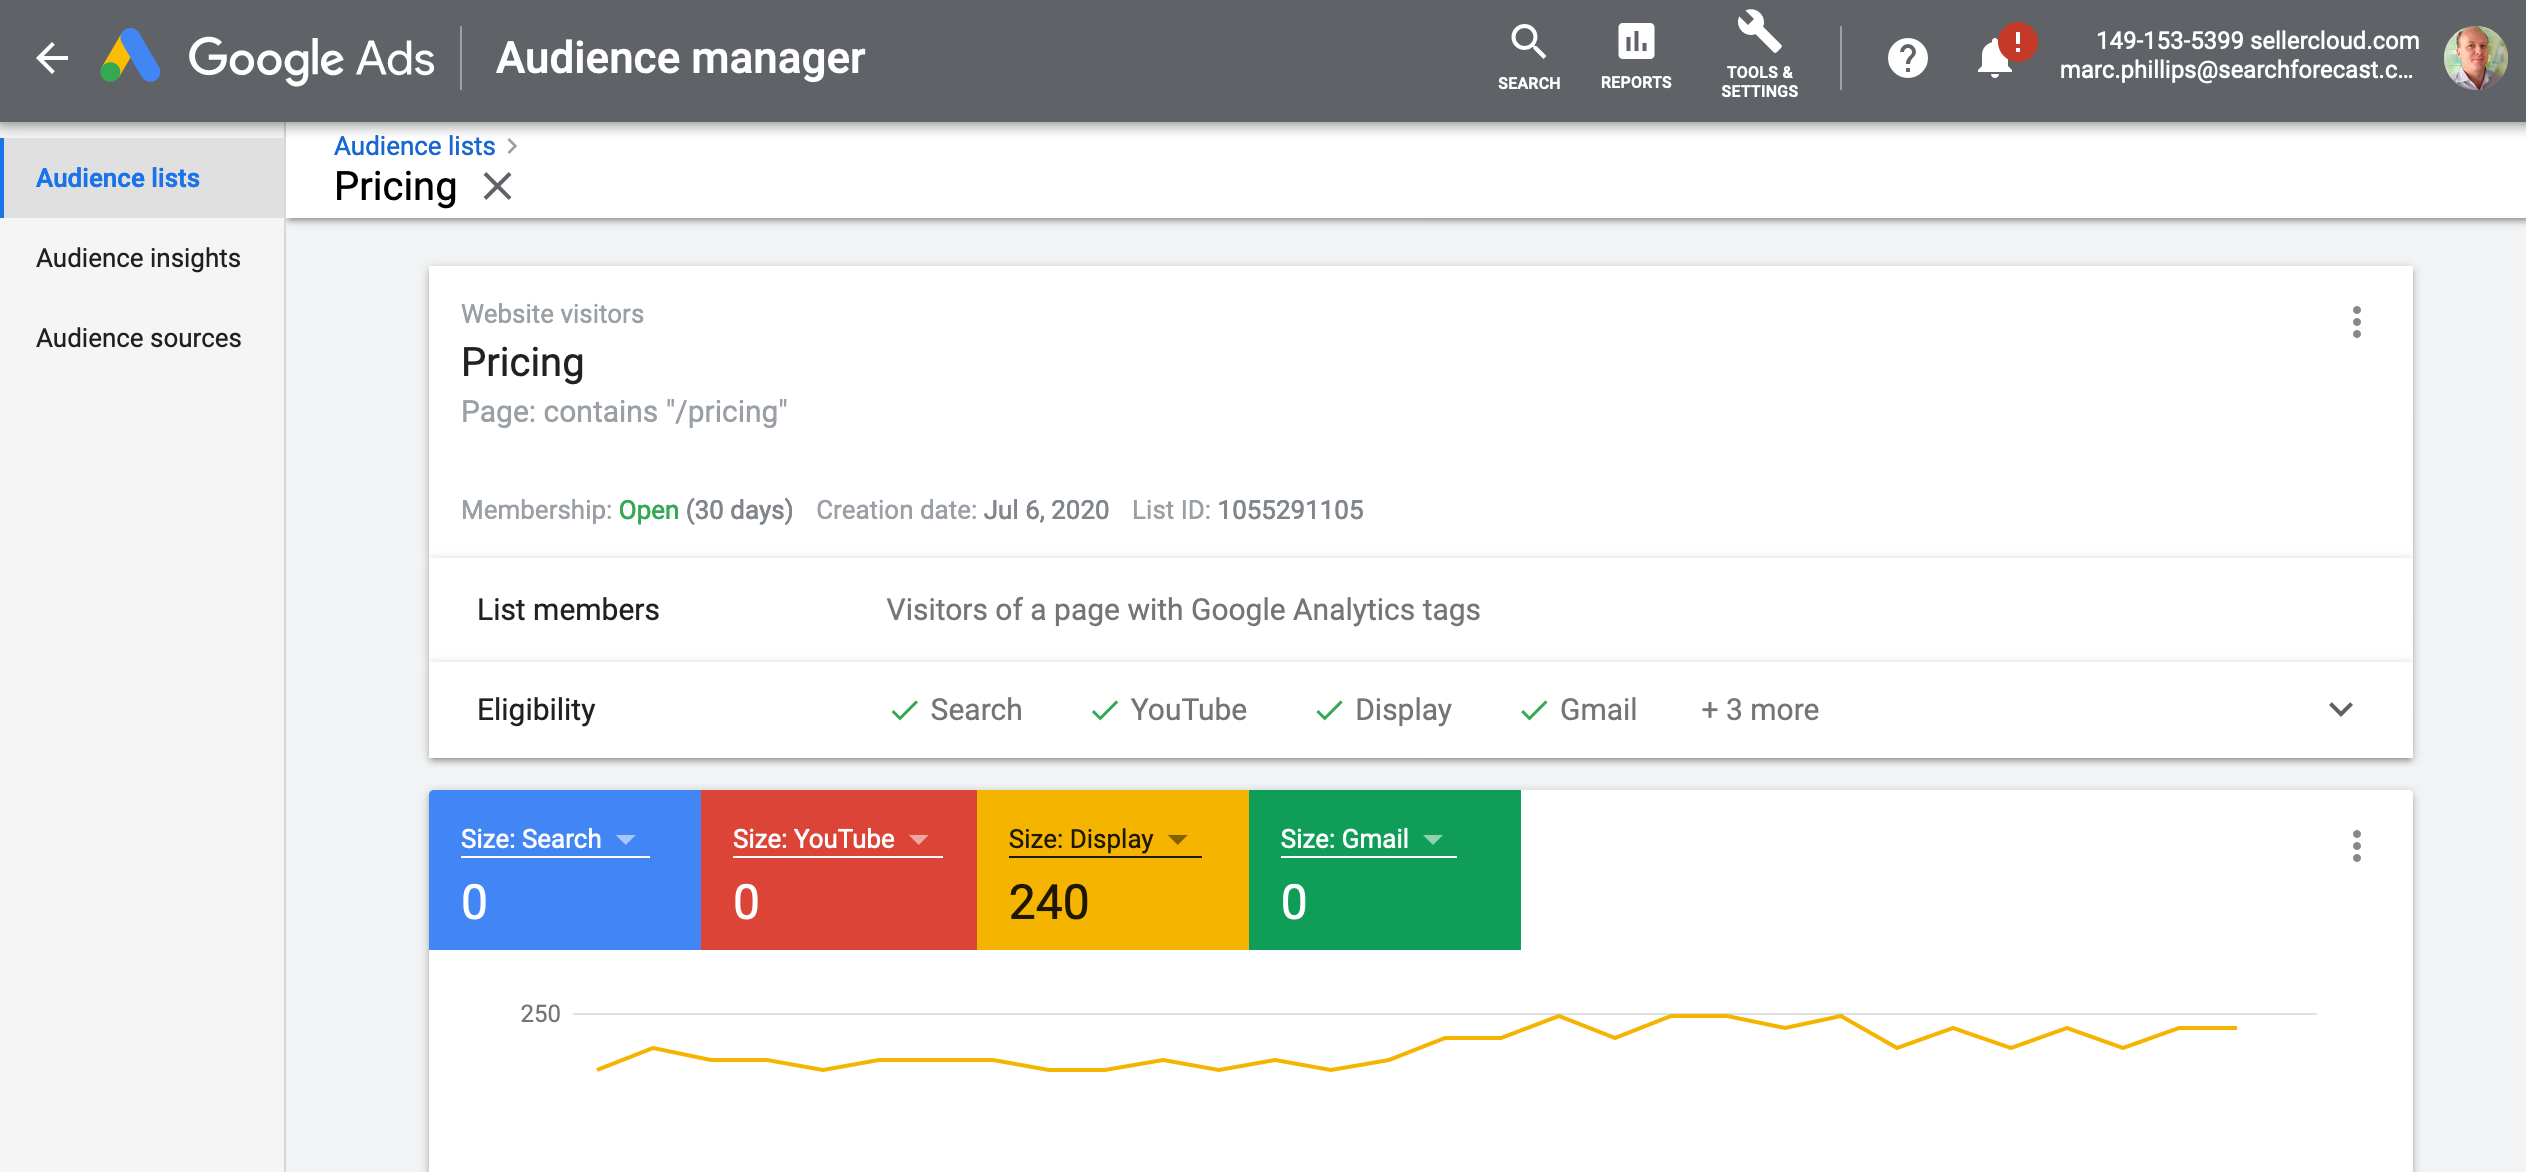
Now, inside Google Ads > Audience Manager, you can see the corresponding Audience as per below. See how the audience equals 240. It typically takes 30 days to build up a good audience that is big enough to start displaying ads to.

Screen Shot 2020-08-16 at 12.18.12 AM

This is a great way to create more targeted banner display ads for niche audiences across a client website instead of just targeting ads to “All Website Visitors”. Thanks Covid!


Bounce Rates on Paid Vs Organic Traffic

Bounce Rates. Experienced people know that higher bounce rates on paid search traffic can impact organic rankings. Generally the rule of thumb is to lower bounce rates on paid campaigns to reduce low quality traffic. As display remarketing also impacts organic rankings (i.e. the number of visitors who click on a remarketing ad and return to your website), the quality of traffic is super important.

Let me unpack this more. The below graph shows the 90% bounce rate a client had been strangled with for several months after spending $7,000 a month on Google Adwords. That’s $6,000 wasted per month.

image

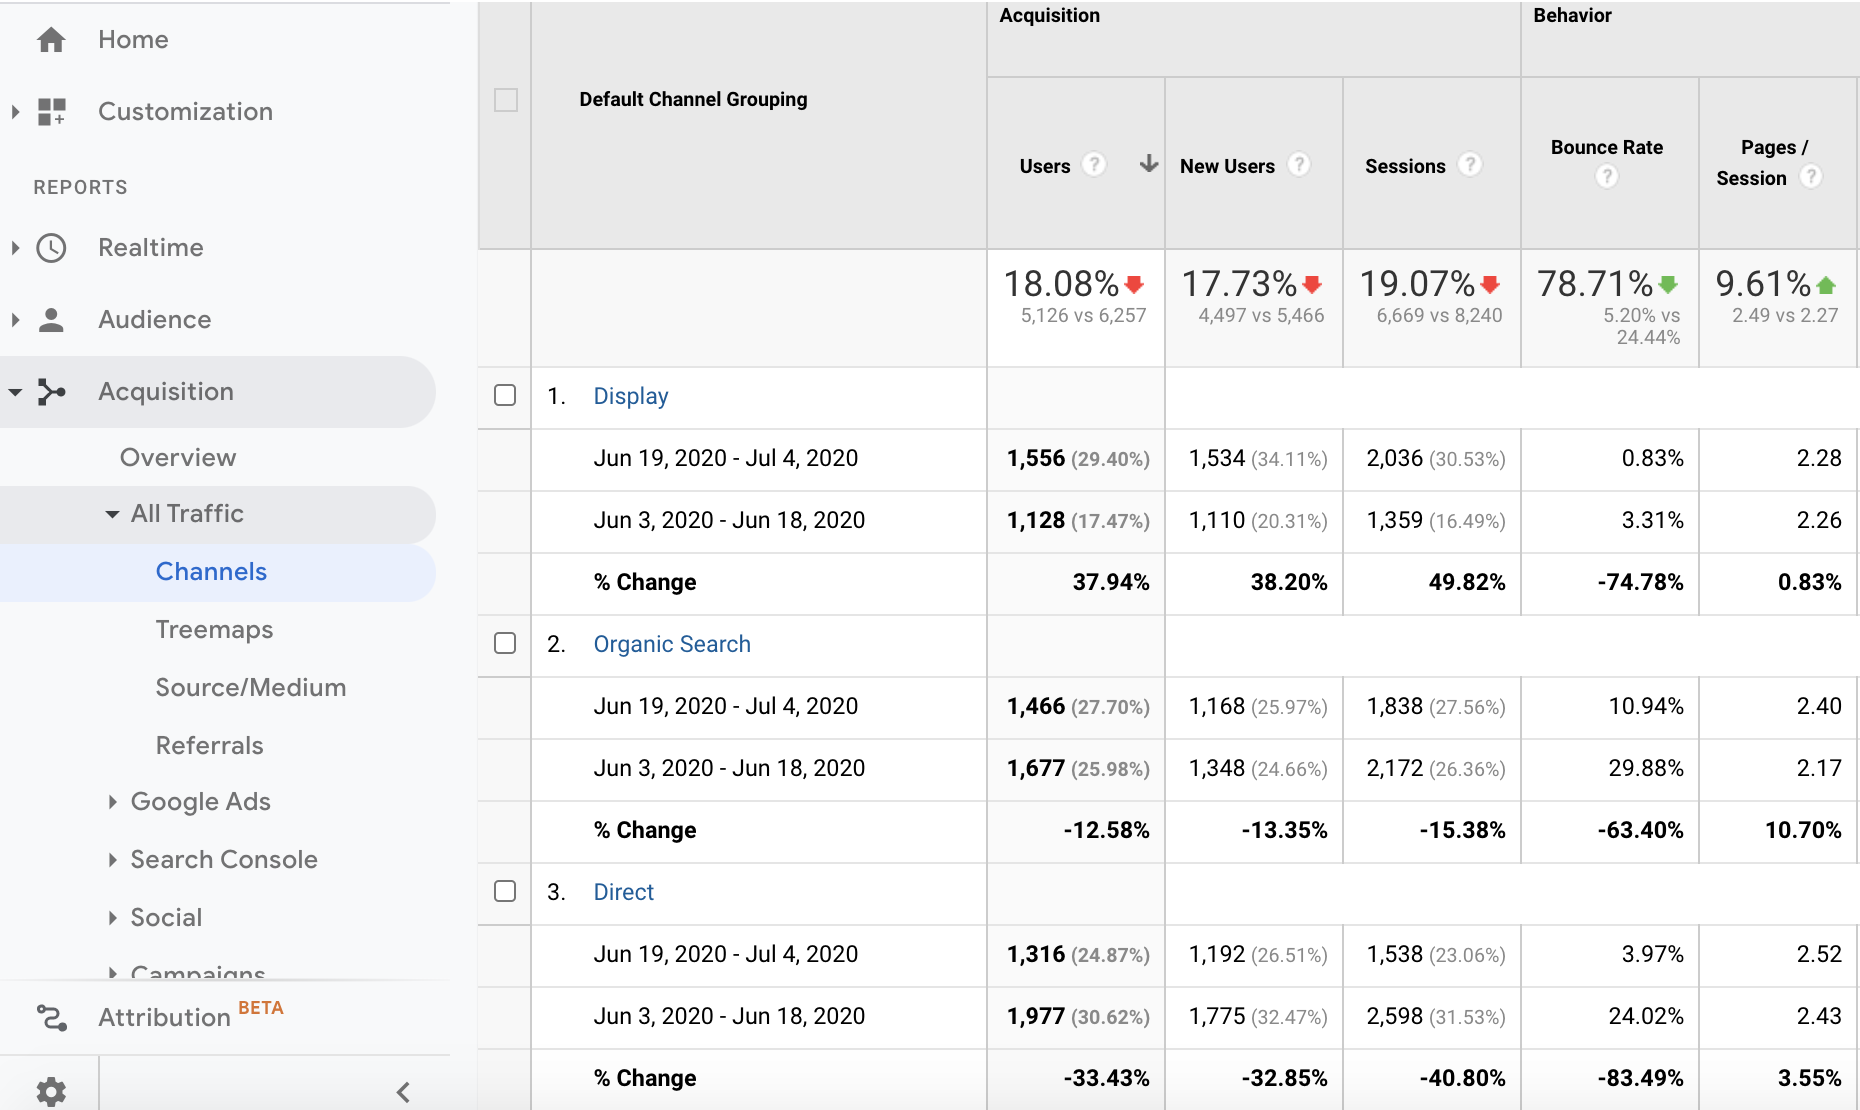
Now let us have a look at the impact of the reduction in bounce rate on organic and direct traffic once the high bounce rate ads inside Google were turned off. Notice there was a 78% improvement in overall bounce rate. Organic bounce rate reduced from 24% to 10% and direct traffic bounce rate dropped from 24% to 4%. You don’t often get to see the causality between paid traffic bounce rates and organic / direct traffic bounce rates yet they are correlated. Oh and the conversion rates on paid traffic were 5x as a result and 6x from organic.Screen Shot 2020-07-05 at 4.08.10 PM

You can think of Google as a foghorn. What you do in paid echos across all other audiences. Remember, if you allow your paid search traffic to put non qualified traffic in the top of the funnel, it affects all the other non paid traffic quality and conversions coming to your website. Simply put, rubbish in rubbish out !

google-foghorn

Google Core Web Vitals Reporting and Validation Fixes

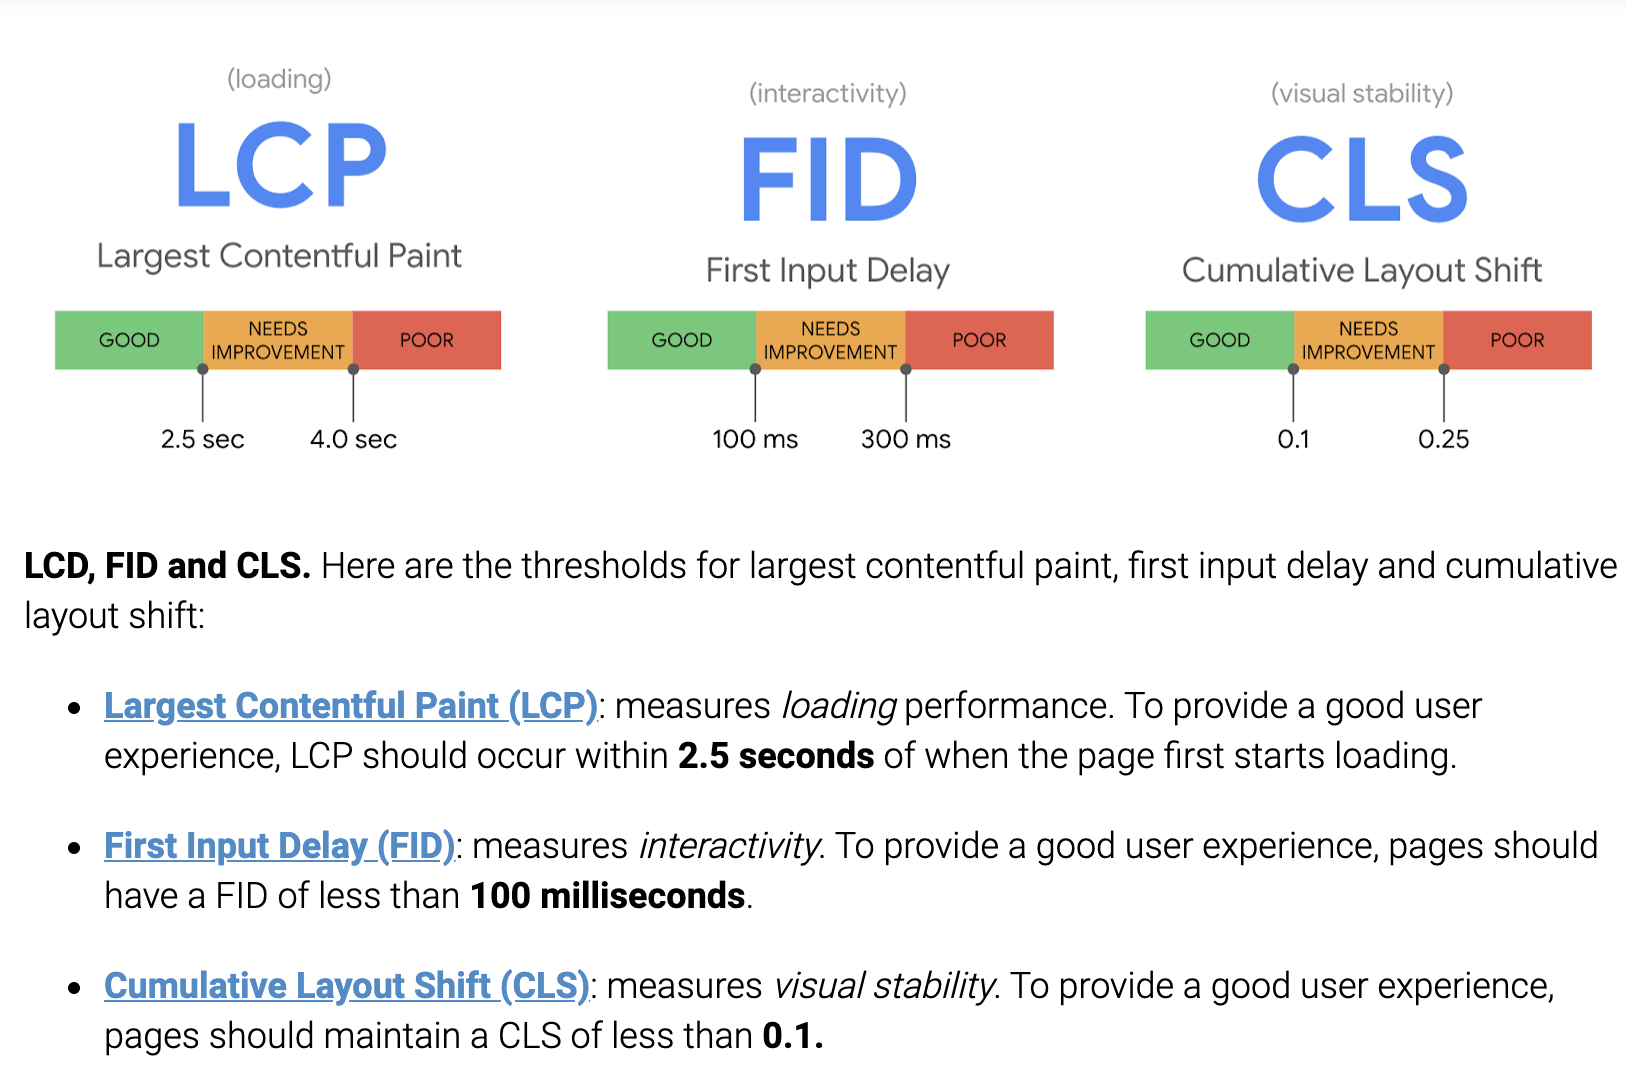
Google recently announced a new algorithm update that will roll out in 2021 that ranks websites on the quality of a user’s experience on a web page. Didn’t they always do this? The new “Core Web Vitals” and it can be broken down into these components below.

CoreWebVitals-searchforecast Google suggests Best Practice should be where a website Largest Contentful Paint (LCP) should occur within 2.5 seconds  when a webpage  starts loading. First Input Delay (FID) measures interactivity and pages should have a FID of less than 100 milliseconds while Cumulative Layout Shift (ClS) measures visual stability and pages should maintain a CLS of less than 0.1.

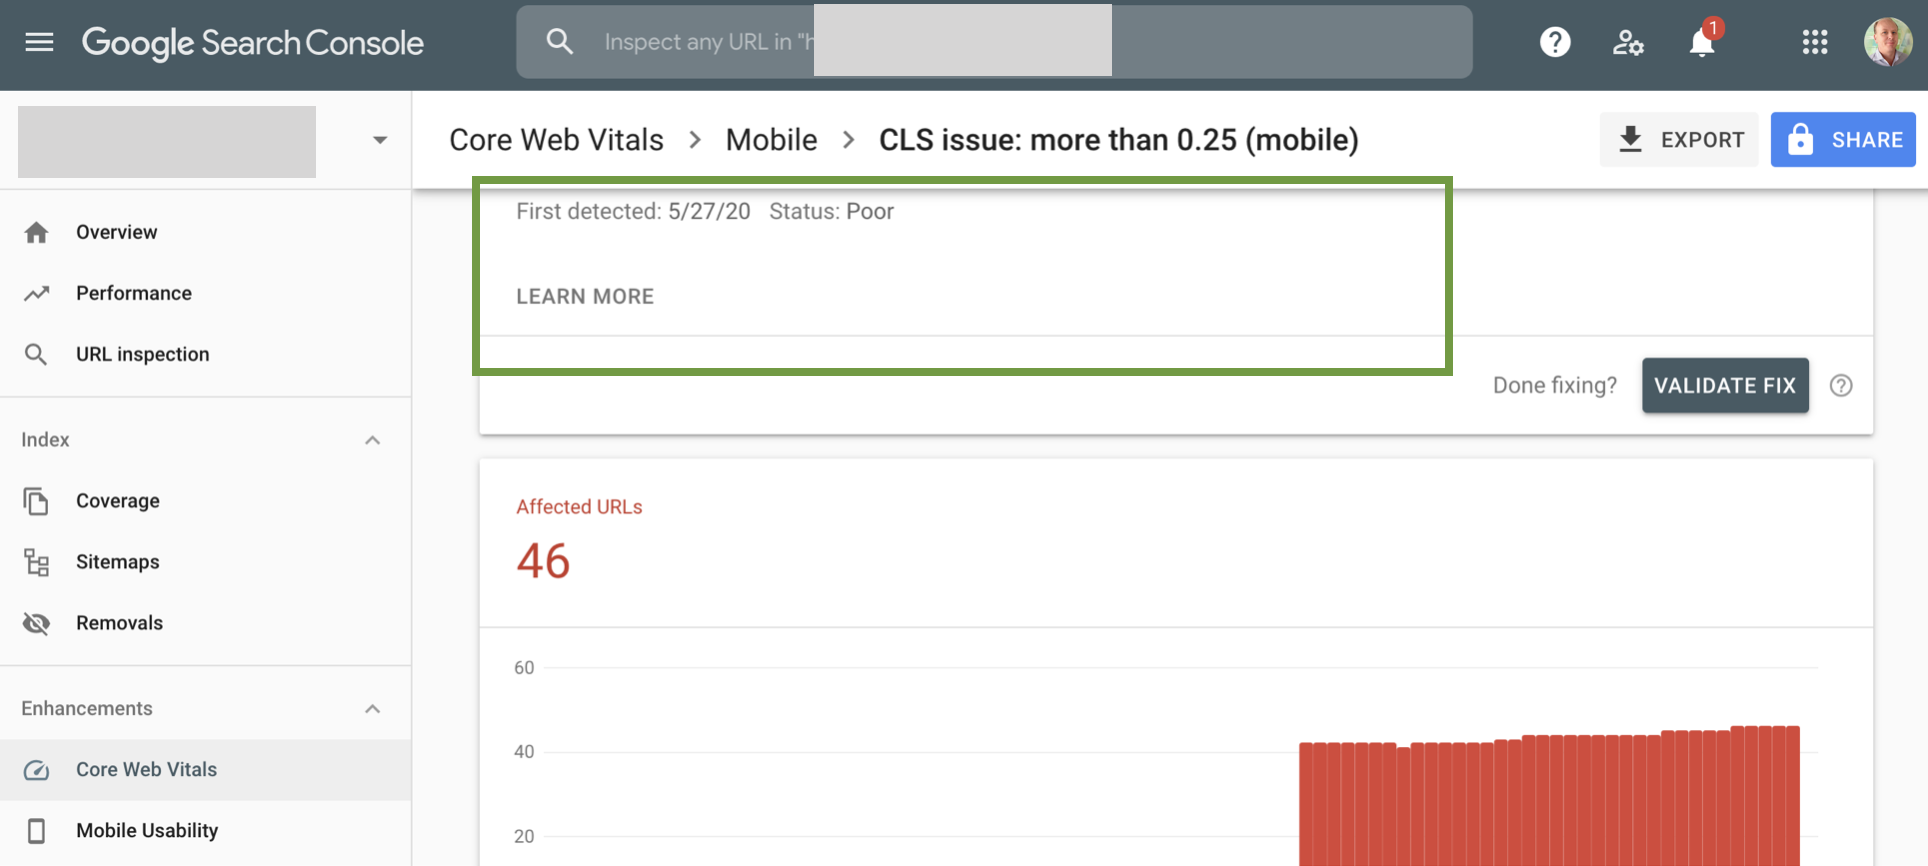
The focus is on speed again and content as always. Interesting, there is a new focus on the stability of content as the page loads. SO what does this mean? So when we found this CLS issue inside Google Search Console for one of our clients across 46 URLs, we followed all the links to ‘Learn More’ yet the links just take you back to https://developers.google.com/speed/pagespeed/insights/ which then doesn’t reference Core Web Vitals. NICE!

google-search-console


Google Takes Gloves off in Fight Against Amazon Product Search

So you’re stuck at home during Covid-19 lockdown / shelter and realize you need some board games for the kids to play with. So do go to Google or Amazon. You know Google shows products under the Shopping Tab and yet Amazon has everything as well right? That split second decision is worth hundreds of billions to both companies as they fight for consumers to visit their website to discover, browse, search and ultimately buy.

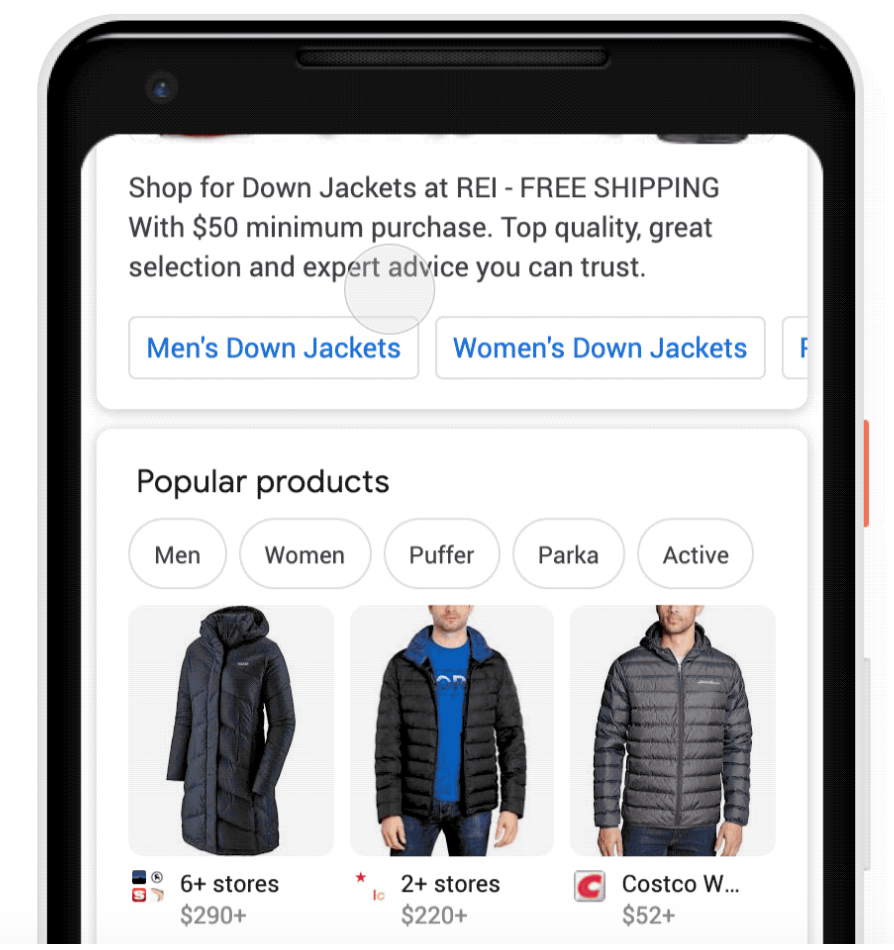
Up until April 2020, Google allowed product data feeds to be uploaded to their Google Merchant Center and advertised at a cost. These would appear as Sponsored Shopping Ads on Google. Then in January 2020, Google announced that products in some categories (shoes, apparel, accessories) would eligible for display in results on Search and Google Images for FREE. That’s right ‘organic listings’ which they put under a ‘Popular Products’ tab – see below.

popular-products

Why is this a BIG DEAL?

Because Google want the all product brands and manufacturers to upload their products to their Google Merchant Center to fight Amazon, the largest online marketplace in the world. Amazon is able to monetize their traffic not only by taking a percentage transaction fee on each product sold, warehoused and delivered but also on the data collected via their advertising search platform.

If you are advertising on Amazon, you should review dash / APPLICATIONS. Built by Amazon ex-employees, the software include data studio, advertising studio and inventory planning, all of which help you sell more on Amazon.

Firefox Browser Extension reduces Creepy Facebook Tracking


We’ve been using Firefox ever since version 1.0 came out in 2003 as it was born out of Mozilla Corp based here in Silicon Valley.

We did because we felt (before Chrome existed) that because 90% of their revenue came from royalties revenue paid by Google, we would glean insights into Google for our clients. In 2006, the Mozilla received US$61.5 million from Google and for 2011-2014, Google paid Mozilla nearly US$300 million annually! From 2015 to 2017, Yahoo Search became the default search engine for Firefox until they cratered as a business and finally in November 2017, Mozilla announced that it was switching back to Google as the default search engine. History lesson over.

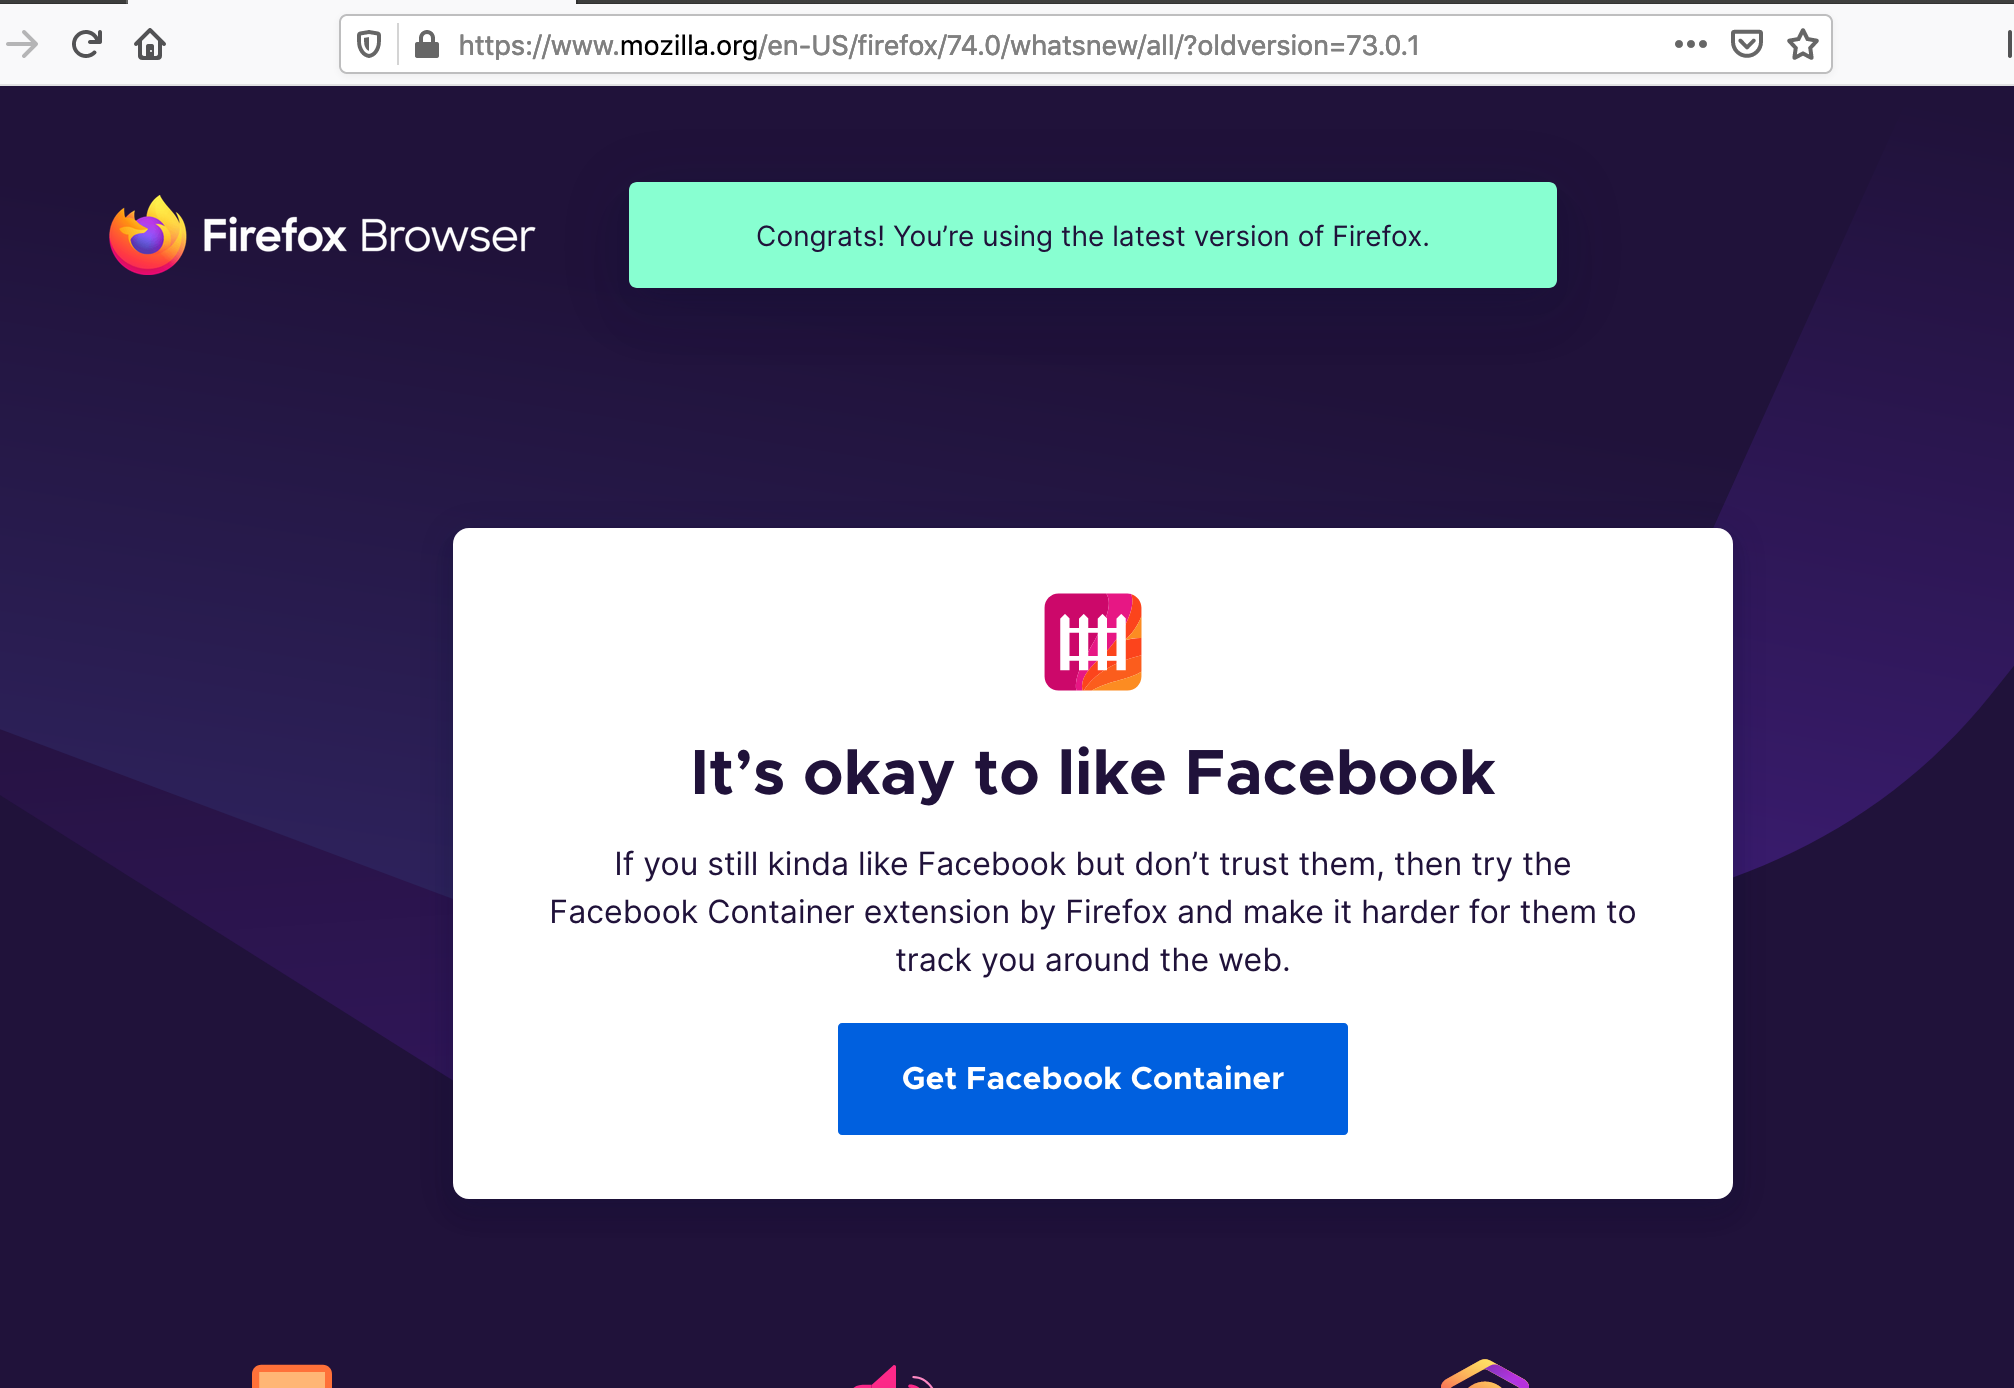
What is alarming is the below pop up shown to Firefox browser users this week! As a colleague noted about Facebook not liking all the talk about regulators breaking their business up, “its a bit like an arsonist who doesn’t like the sound of fire engines!”

firefox-facebook

Mobile First Content & Responsive Design Insights

At some point, design matters to optimization and while we don’t lead with design in client engagement, we know once the plumbing of the website is fixed, Googlebot want to see some improvement in design components. Particularly Googlebot for mobile which will be switching to mobile-first indexing for all websites starting September 2020.

The most important element is to have mobile first content. People are on the move and the information needs to help with their intent to find a store or location. The design needs to be bite sized as people on mobile devices wont read long text. Meta tags need to be the same on desktop and mobile. Show phone numbers straight up. People want to call, particularly if they are driving! Images help convey on mobile phones the text. Tip: Choose images and then write the copy! Here’s a design our in-house designer did recently for a client..

07_Solution-main_mobile.


Are Google My Business Pages Reducing Website Visits?

As strange as it seems, we have noticed across 6 client websites and Google My Business Pages insights that there is a progressive inverse correlation trend. This means that when client website non paid traffic (both direct and organic traffic to websites) falls, the Google My Business Pages increases! Another way to think about this is that visitors searching on  Google for businesses are clicking on the right hand side of the Google results page, known as the Google Knowledge Panel.

It does not surprise us to see that Google ‘taketh away’ traffic from websites ranking organically in their search results pages by promoting the Google Knowledge Panel listings in a way that is more enticing for visitors to ‘click’ on that instead of the website listing. We do see inside Google Analytics that when some clients spend less on Google in a month, the non paid direct and organic traffic often increases. And vice versa.

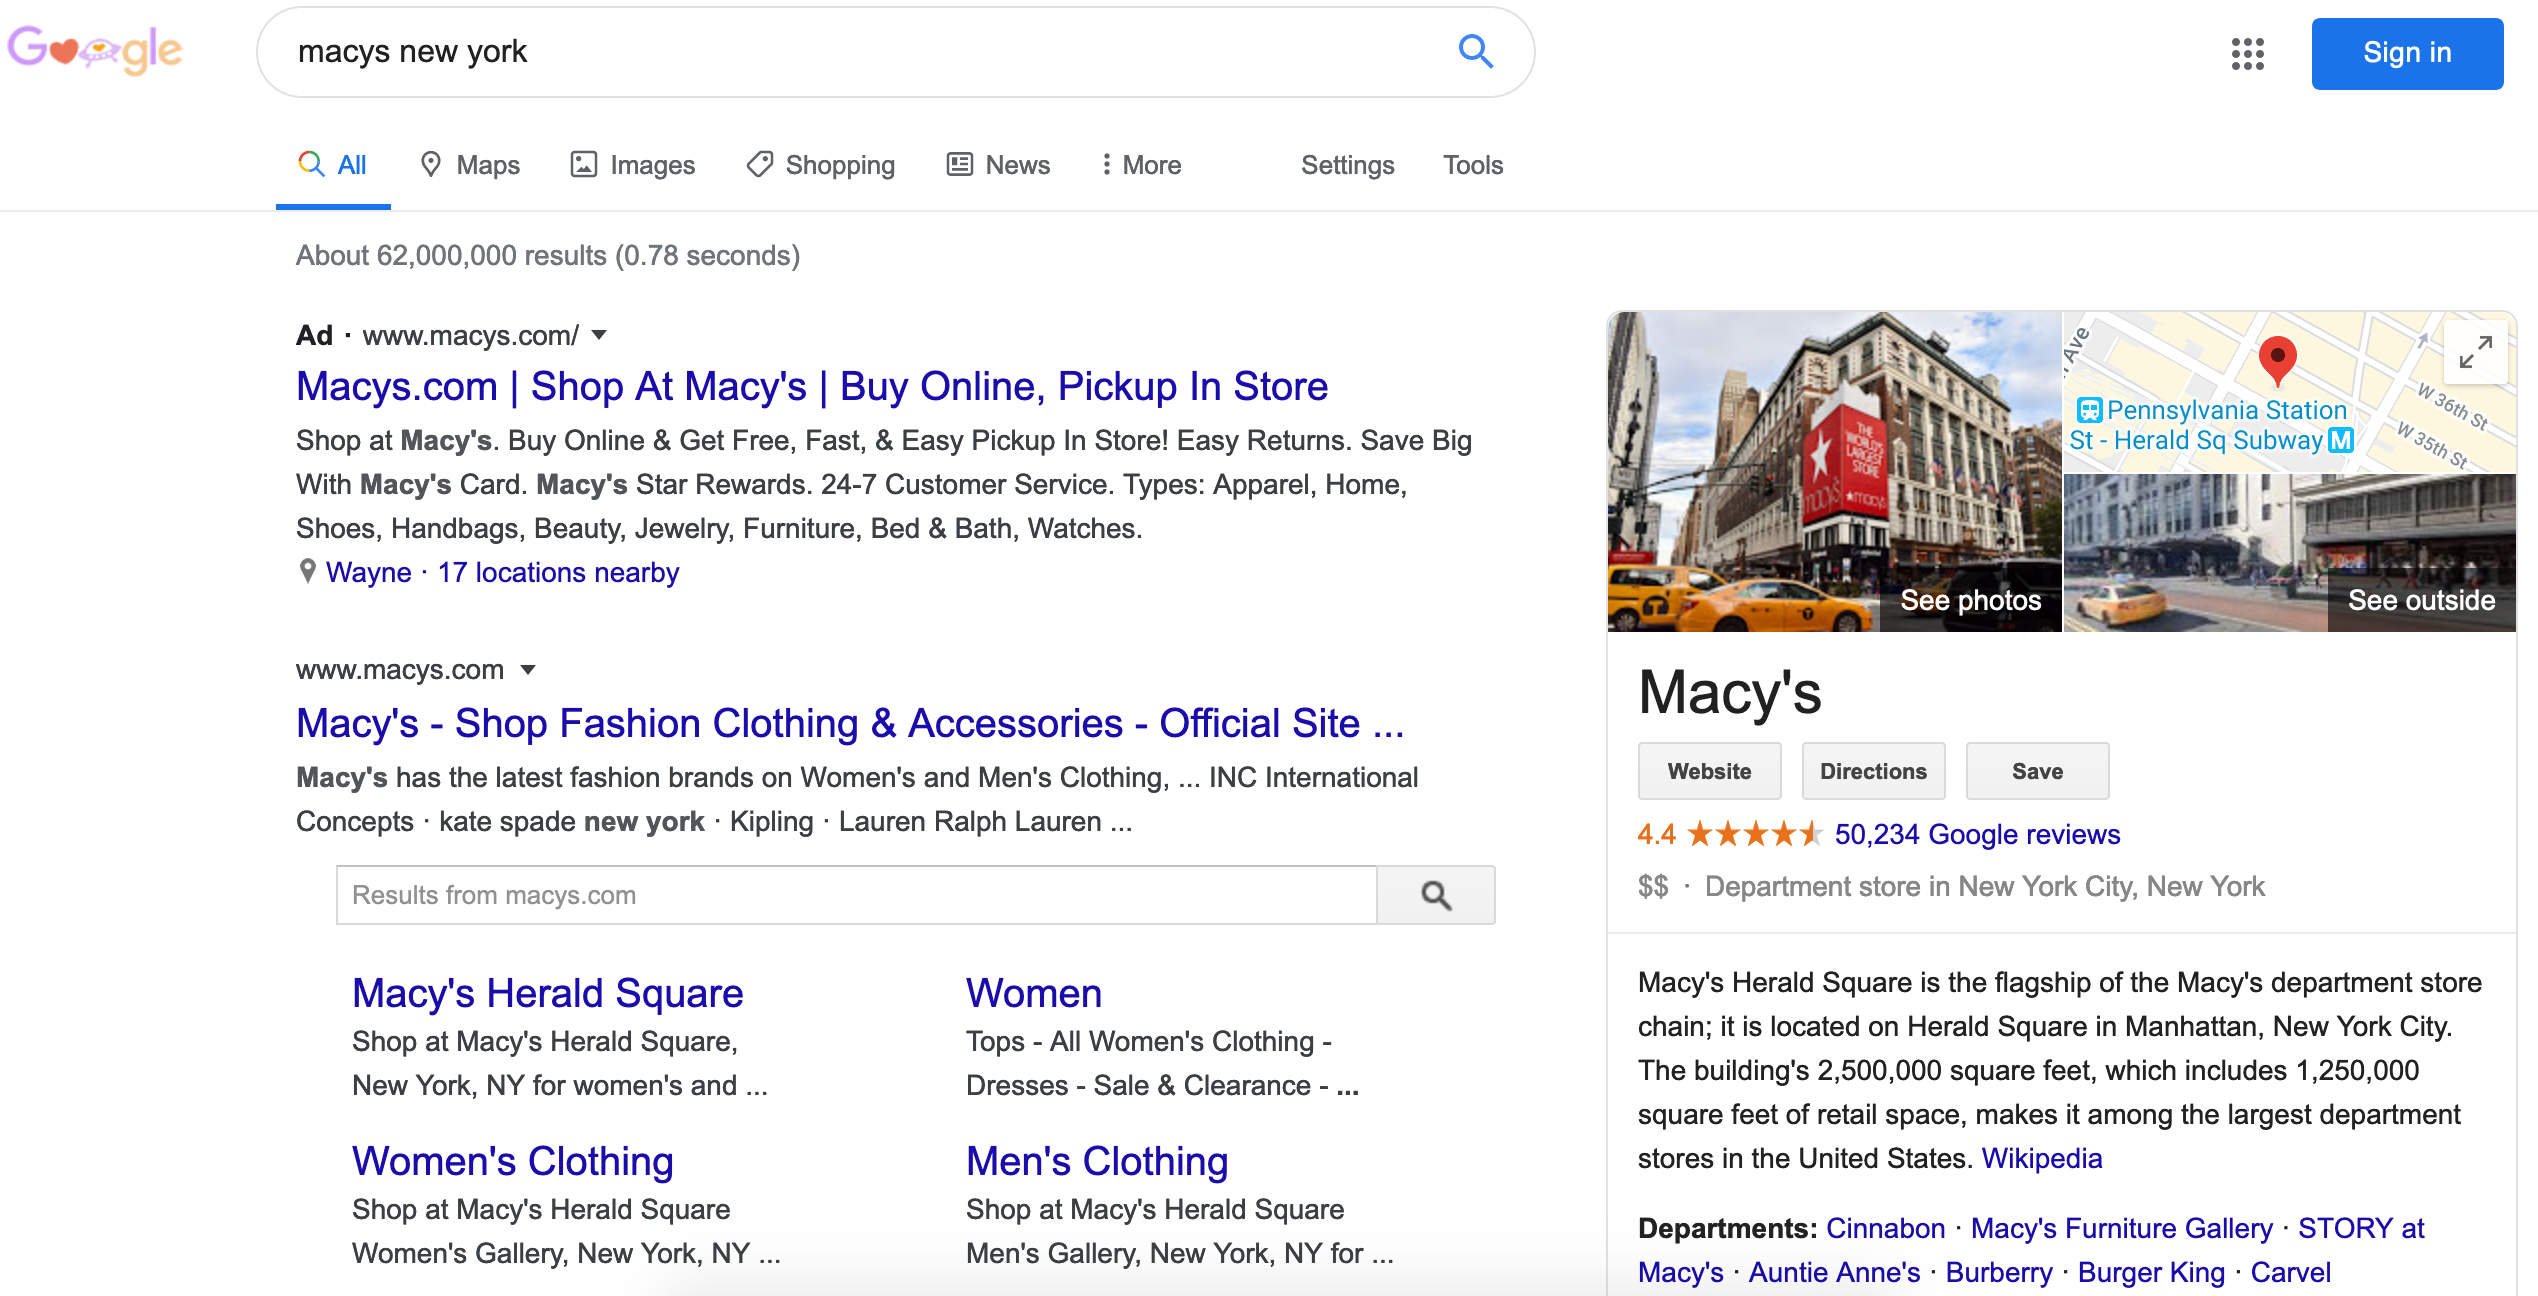
Take for example the search query “Macys New York”. Now look at the left Versus right listings. While the OnSite Search Schema implemented using Google Tag Manager by Macys.com enables a search box to appear under their organic listing, the Google Knowledge Panel (powered in part by the Google My Business Page + Reviews and other citations) is more appealing visually isn’t it! From a consumers perspective, perhaps it is deemed more independent? Of course, that depends what users are searching for. Is it the address or phone number or is it a specific product the consumer knows only Macy stocks.
Screen Shot 2020-02-13 at 1.57.01 PM

As a refresher, Knowledge panels are information boxes that appear on Google when you search for entities (people, places, organizations, things) that are in the Knowledge Graph. They are meant to help you get a quick snapshot of information on a topic based on Google’s understanding of available content on the web.

But they are taking traffic away from business websites. Explaining this to clients isn’t exactly easy for them to wrap their heads around or warming their hearts, particularly as they invest heavily into their websites. We have long held the view that Google will eventually be a page 1 paywall and for Google, eating away on the right hand side of the page.

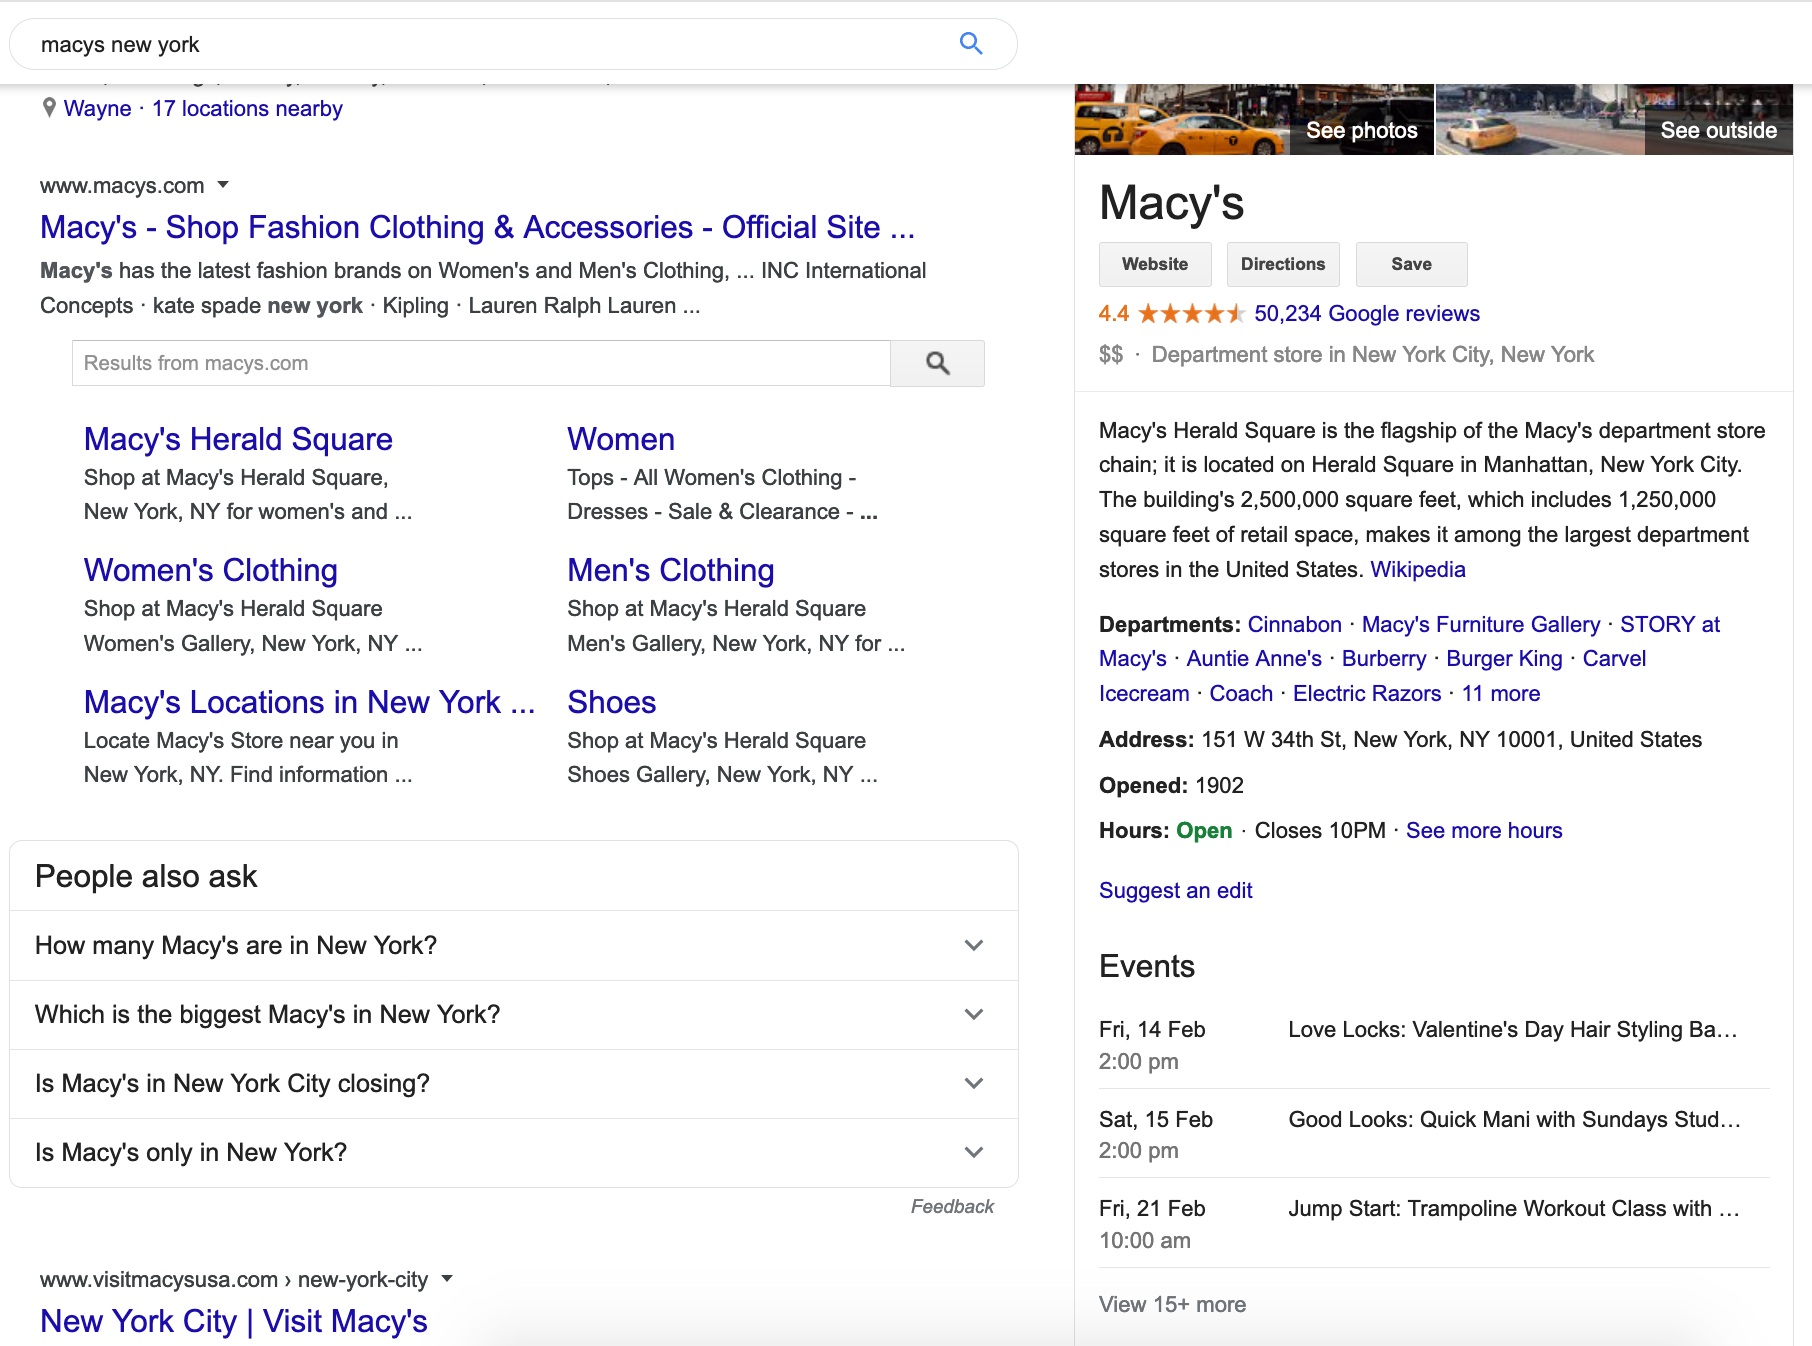
If you scroll down the Google results page using the the search query “Macys New York”, you will see the Knowledge panel includes Events (which are loaded up inside the Google My Business Dashboard.
Screen Shot 2020-02-13 at 2.08.55 PM

Scrolling down further you will also see ‘Questions and Answers’ – a relatively new section Google launched where via Google My Business, answers can be provided to questions asked by the general public. And lastly, you’ll see (as below) the ‘Reviews’ and ‘Plan your visit’ section. While businesses can respond to reviews from within their Google My Business account, the histogram showing live traffic comes from the ‘Store Visits’ data that Google collects and shows inside Google Analytics. That is, they track users who have clicked on the Macys.com website and also those who have their Location Tracking settings from their mobile / cell phones enabled. This is how geo-fenced advertising is also run.
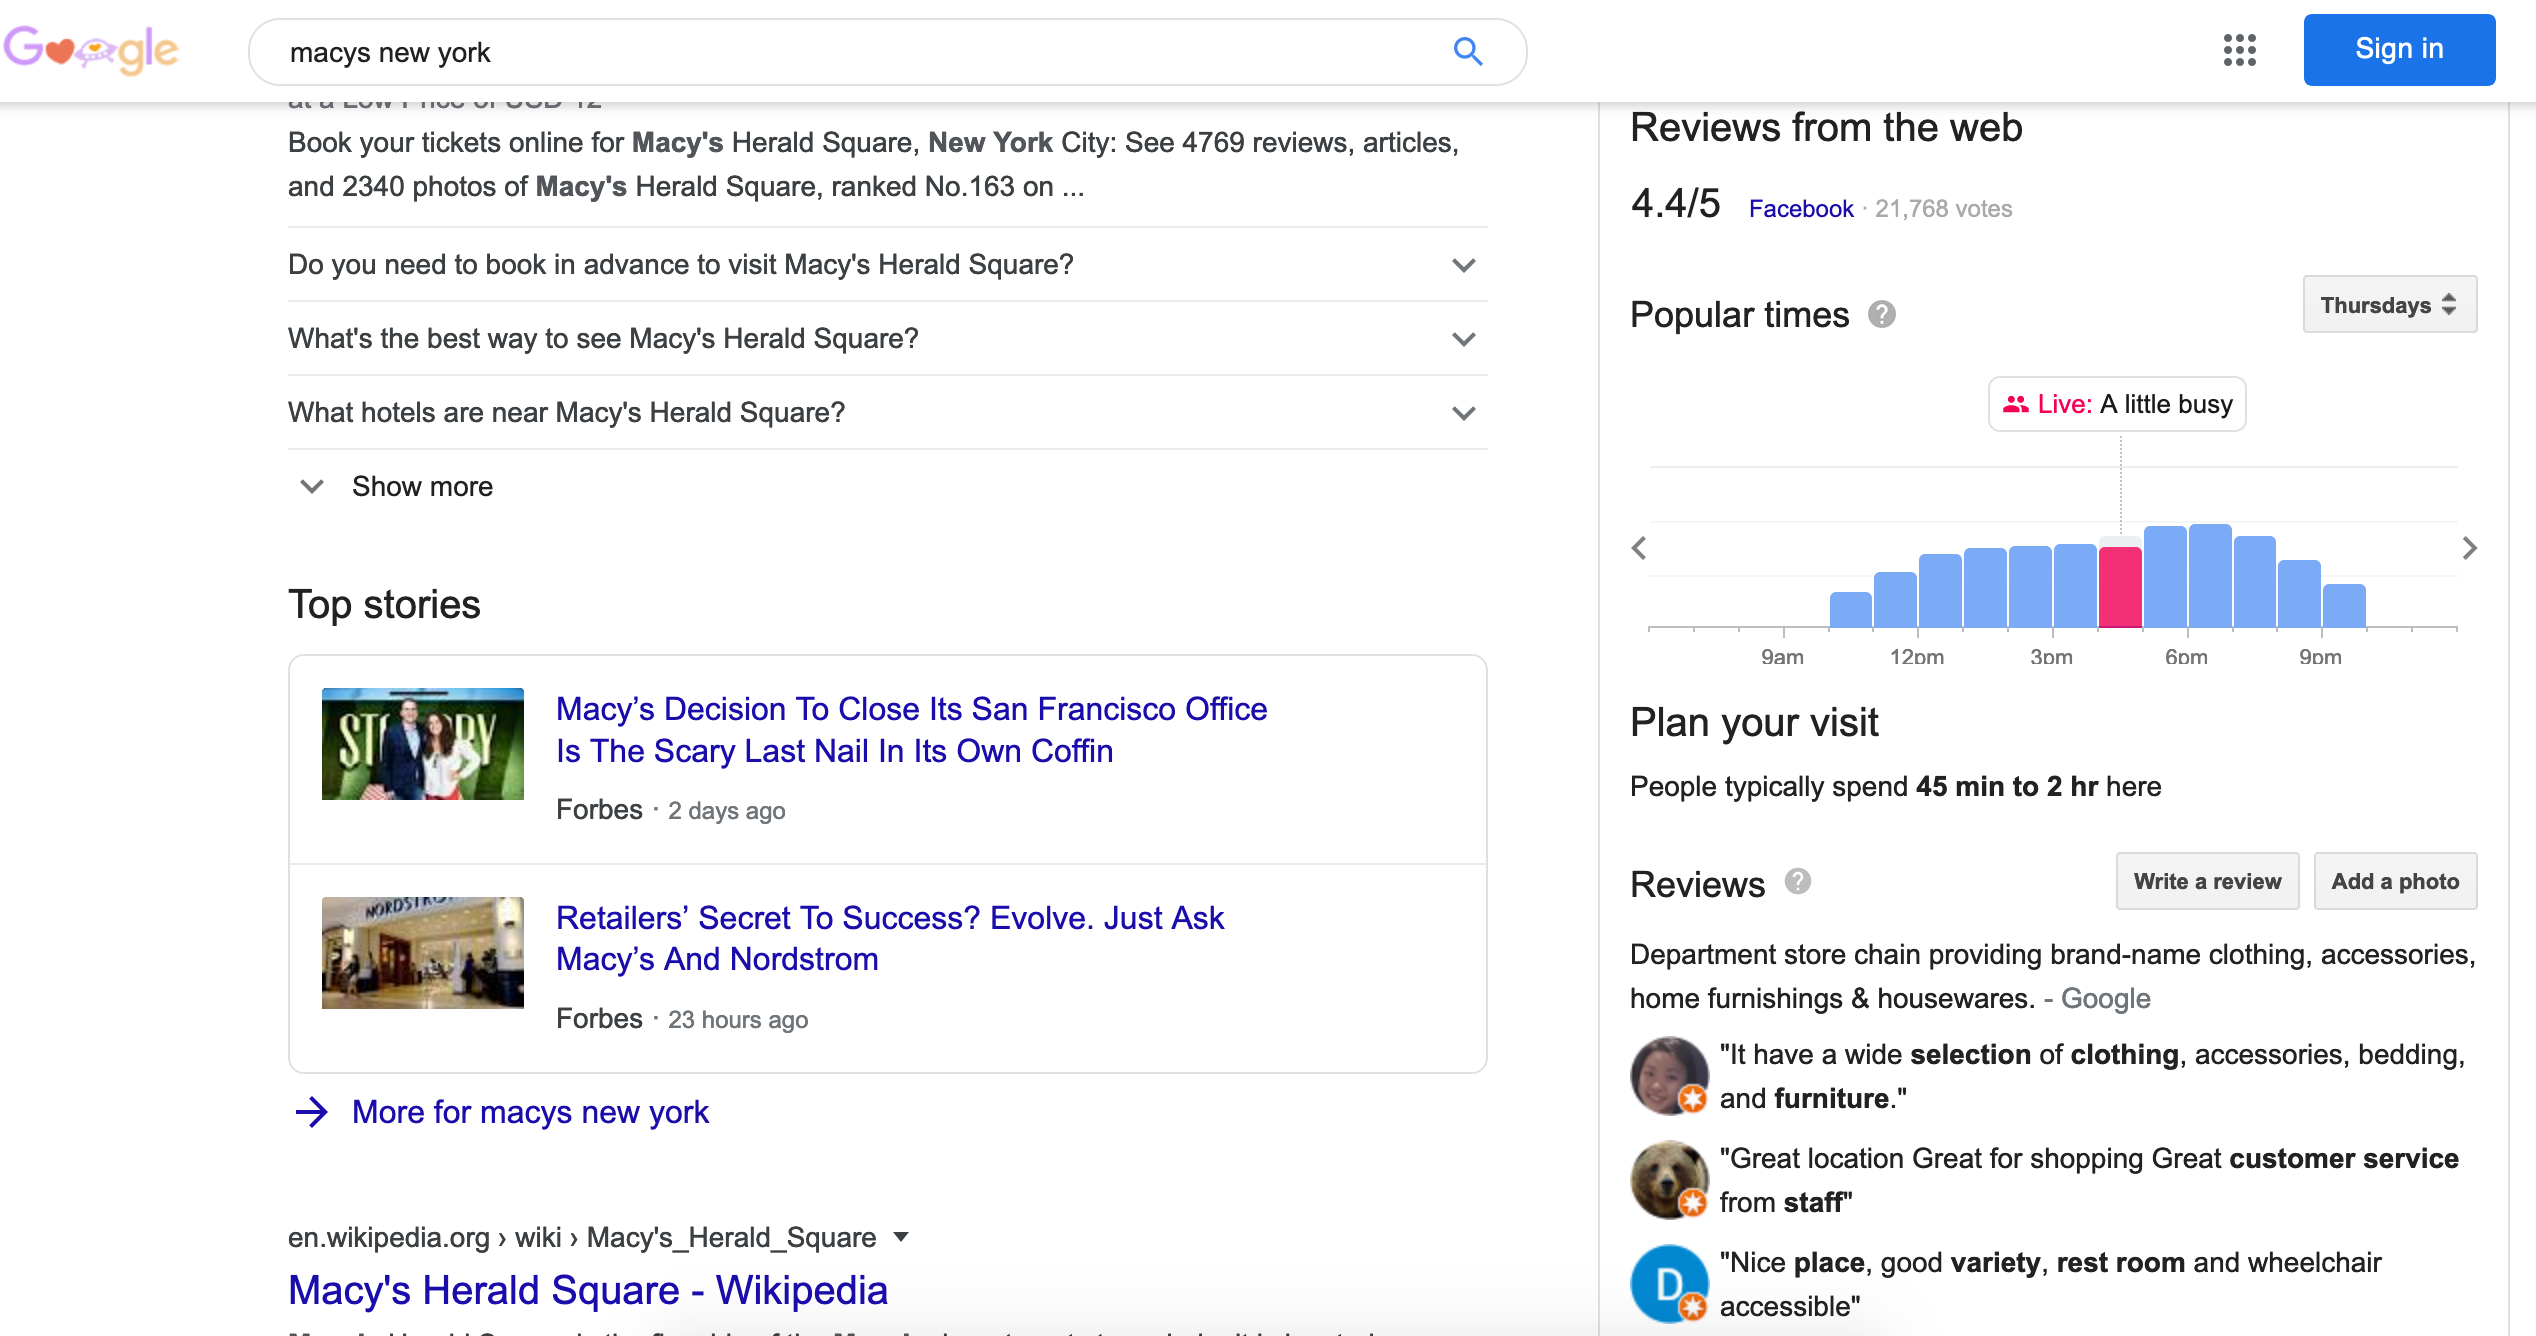
Screen Shot 2020-02-13 at 2.12.24 PM

Using this example of “Macys New York” (https://www.google.com/search?client=firefox-b-d&q=macys+new+york), you will note that the entire page 1 right hand side is the Google Knowledge Panel and the only other listing on the left hand side of the page apart from Macys.com is the “People Also Ask” questions (referred to as Google #Zero Ranking) Wikipedia’s page on Macys, a micro site called https://www.visitmacysusa.com/new-york-city and a TripAdvisor page on ‘things to do in New York” as well as 2 “Top Stories” which go to companies who advertise on Google.

Watch this space!

Top E-Commerce Engagement Metrics

Deep inside the minds of most analytically trained people is the curious trait that questions performance – both offline and online. Google Analytics provides increasing insight for optimization of user engagement. Here’s a look at several of the engagement metrics to be aware of and insights:

1. Organic Search Drives 50% of Store Traffic for Retailers.

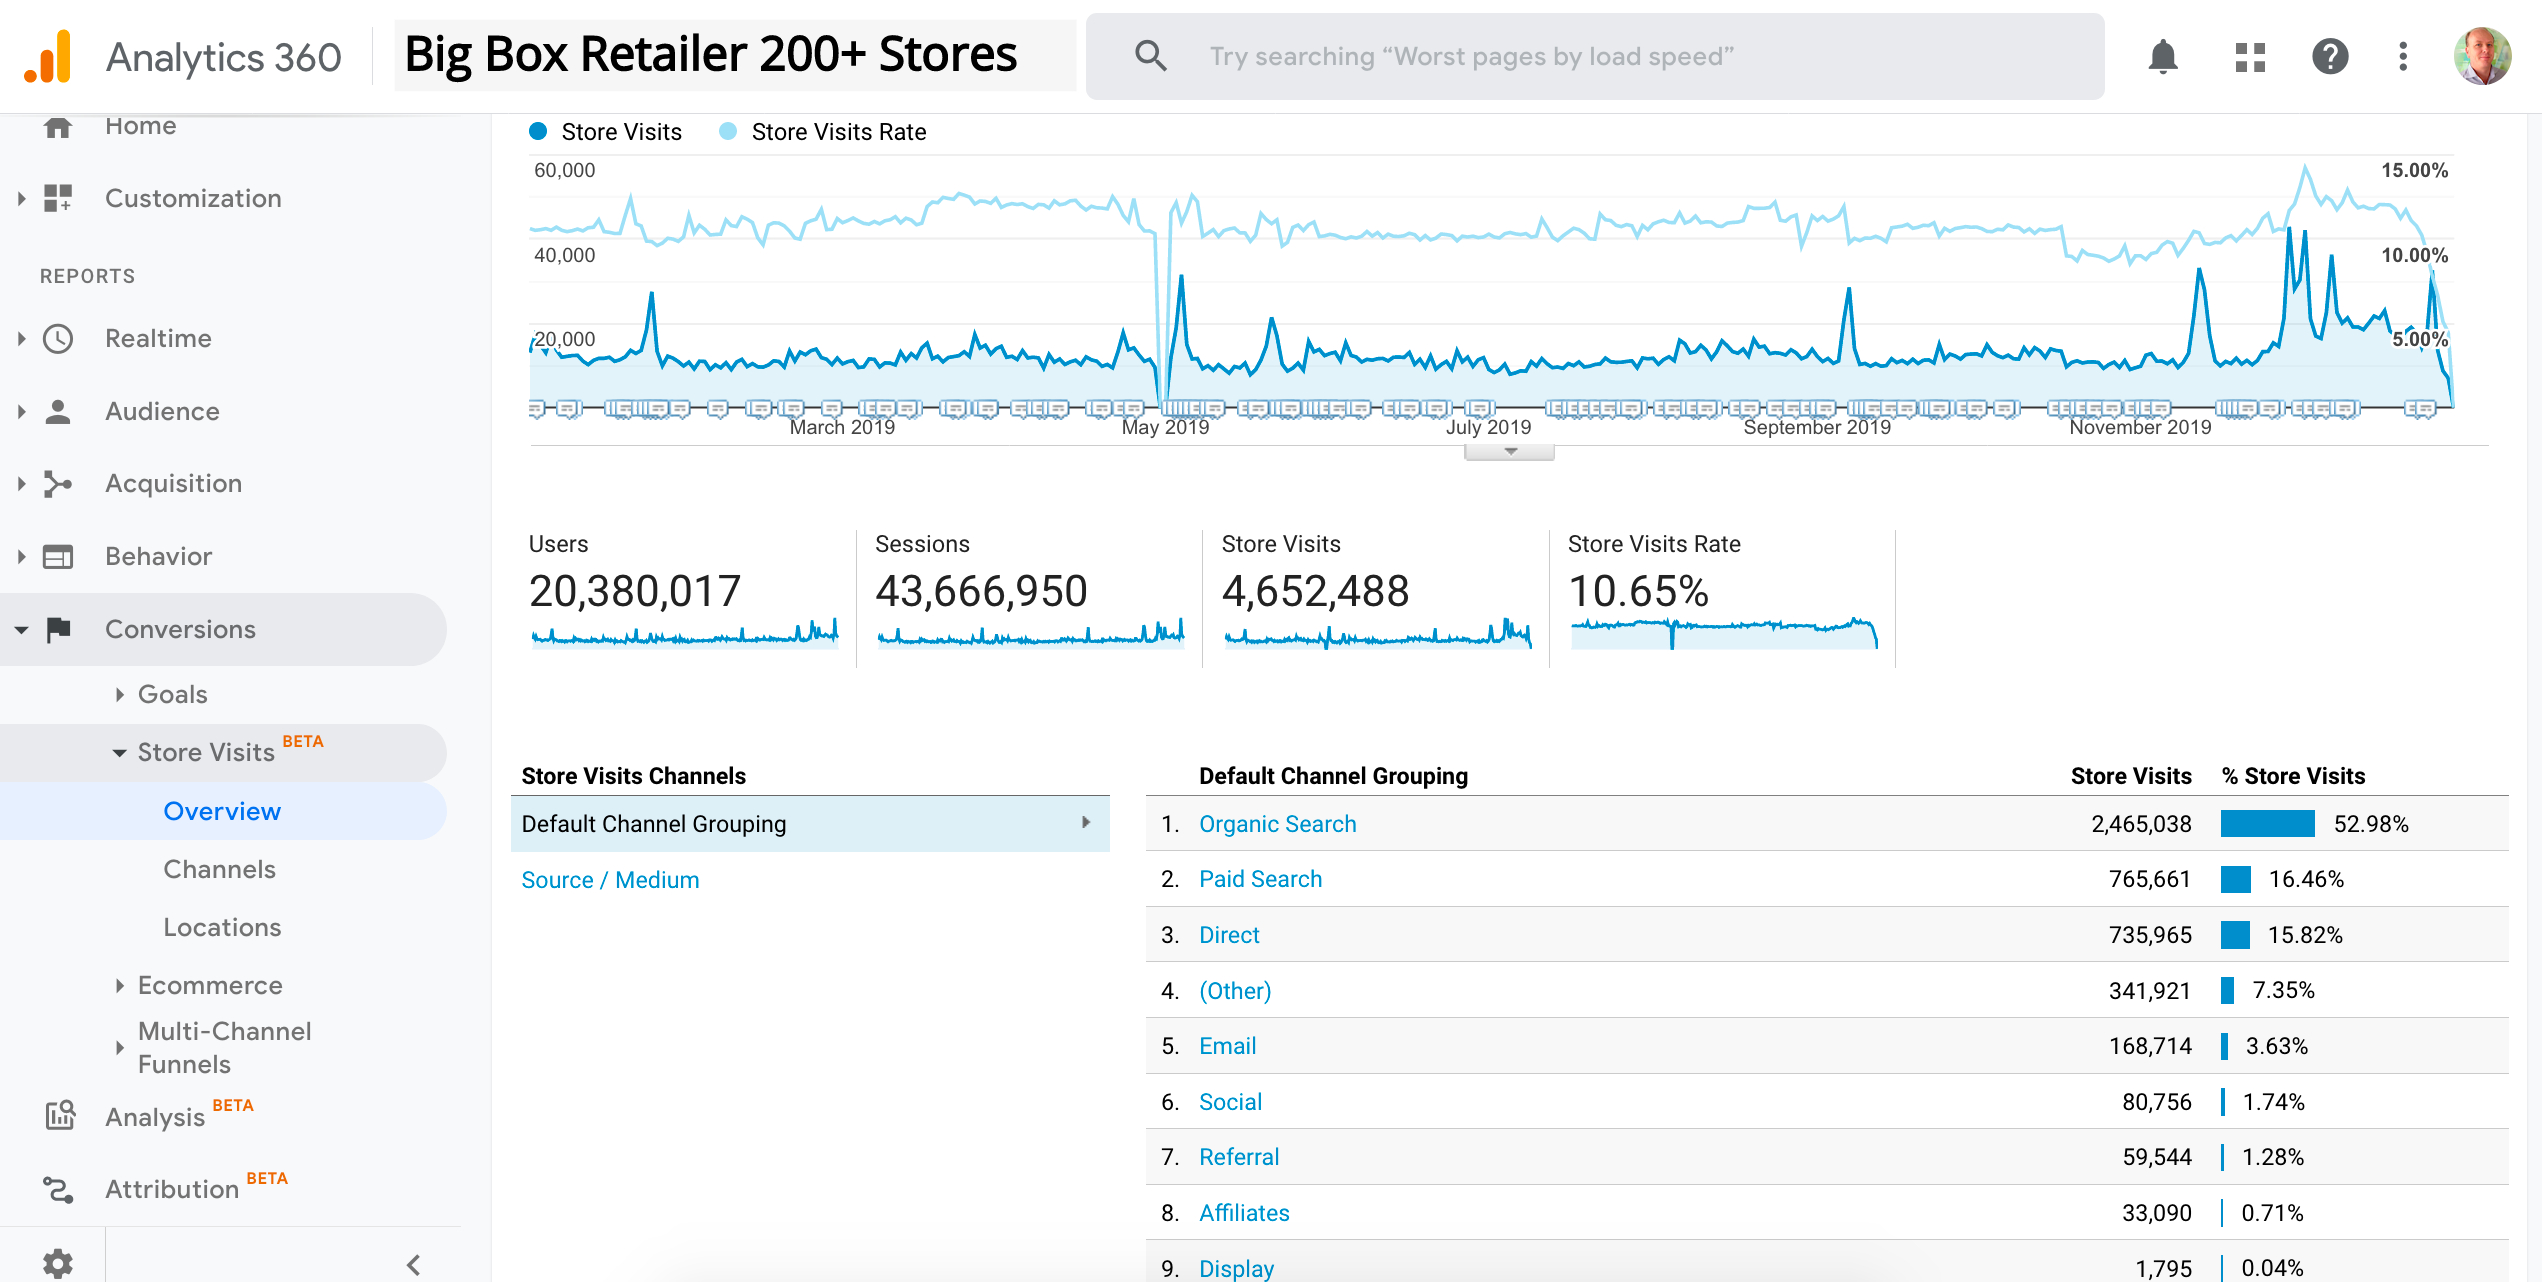
As seen in the below screenshot, one of our clients websites (with over 200 retail stores) had over 20 million user sessions in 2019. 52% of store visits resulted from those who visited their website from an organic search listing. 10% of all user sessions resulted in 1 store visit. This is a key ‘engagement metric’ and one all omni retail channel managers should be tracking.

big-box-retailer

2. Optimized Page Length for Conversions

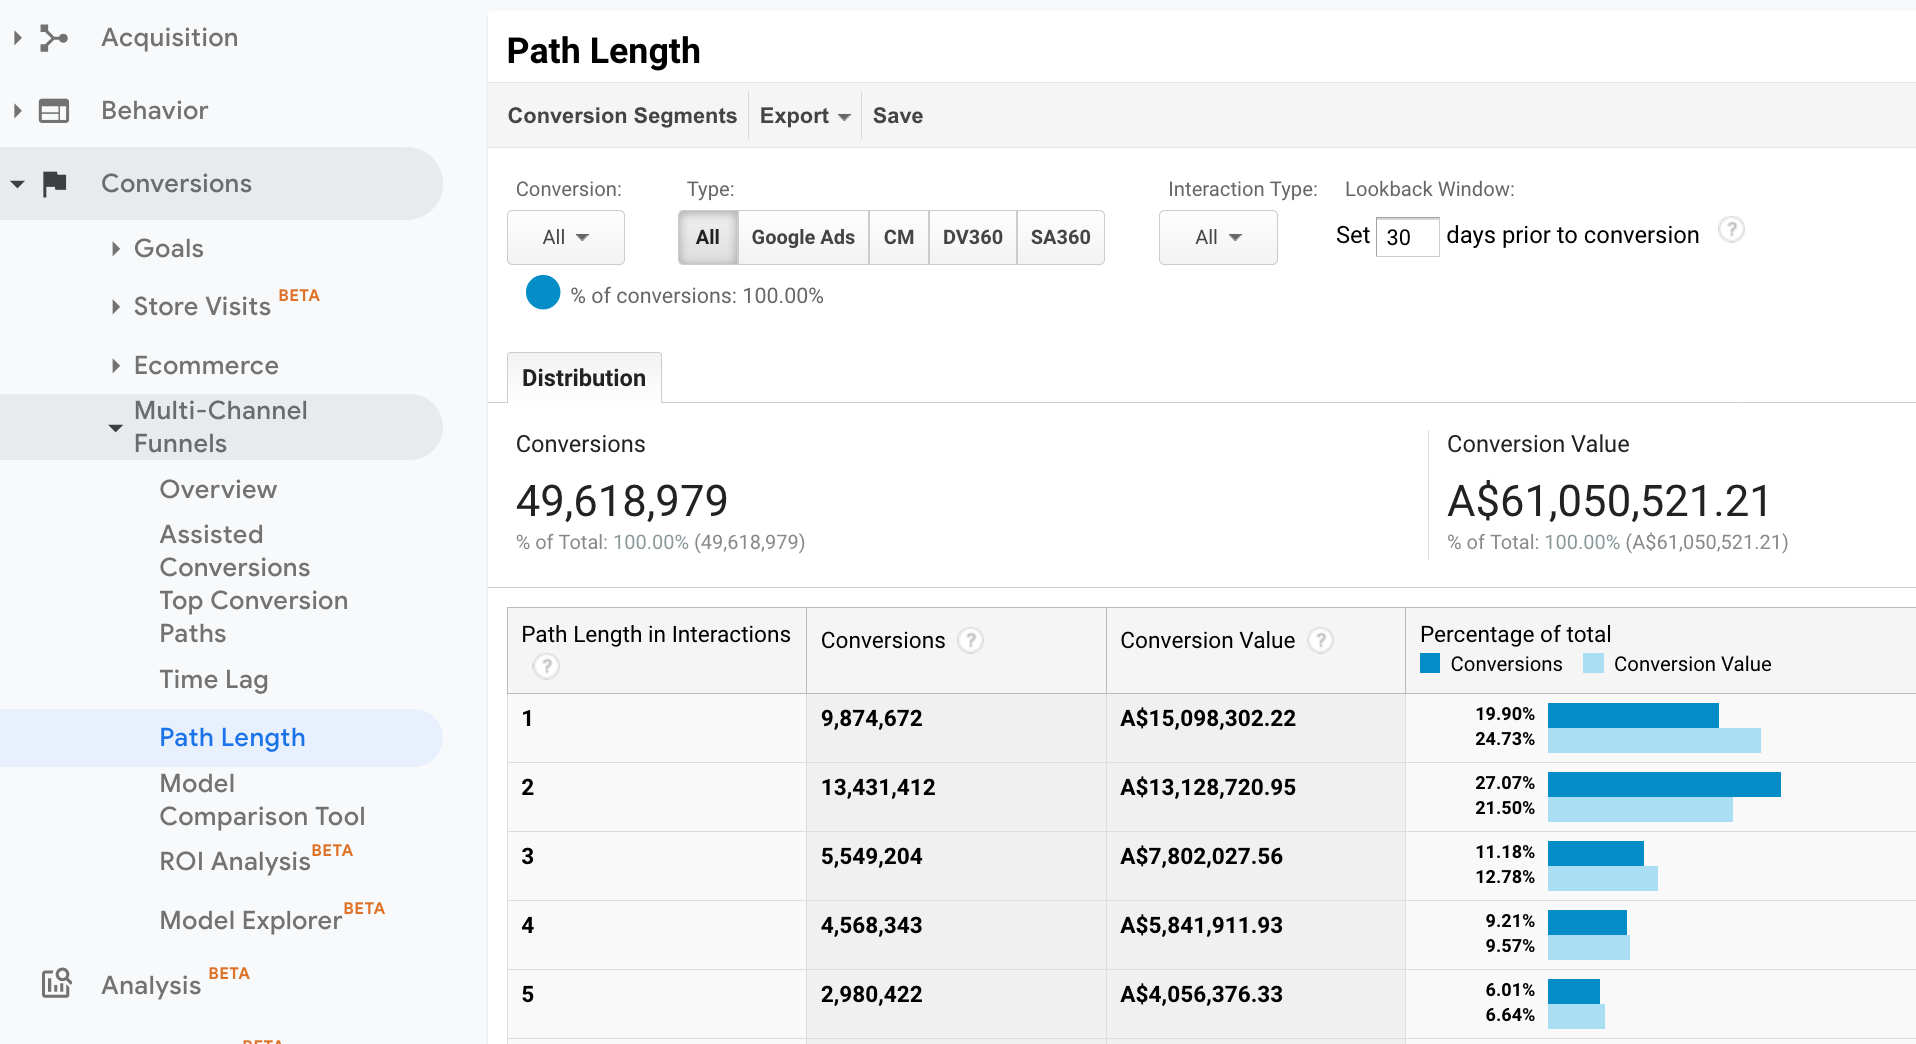
As seen in the below screenshot, one of our clients had a $61M turnover in from Jan 1 to Dec 31, 2019 and the number of pages it took to convert 46% of conversions was 1-2 pages. In e-commerce, product page optimization is critical. Shoppers are impulsive and expect all the information to be on one page (product reviews, price, delivery, guarantee, promotional price, etc). The key is to focus on the product page and make that perfect as online shoppers are fickle and dont want to click around the site unnecessarily.

Screen Shot 2019-12-30 at 3.56.59 PM

3. Onsite Searches as a % of Total Users

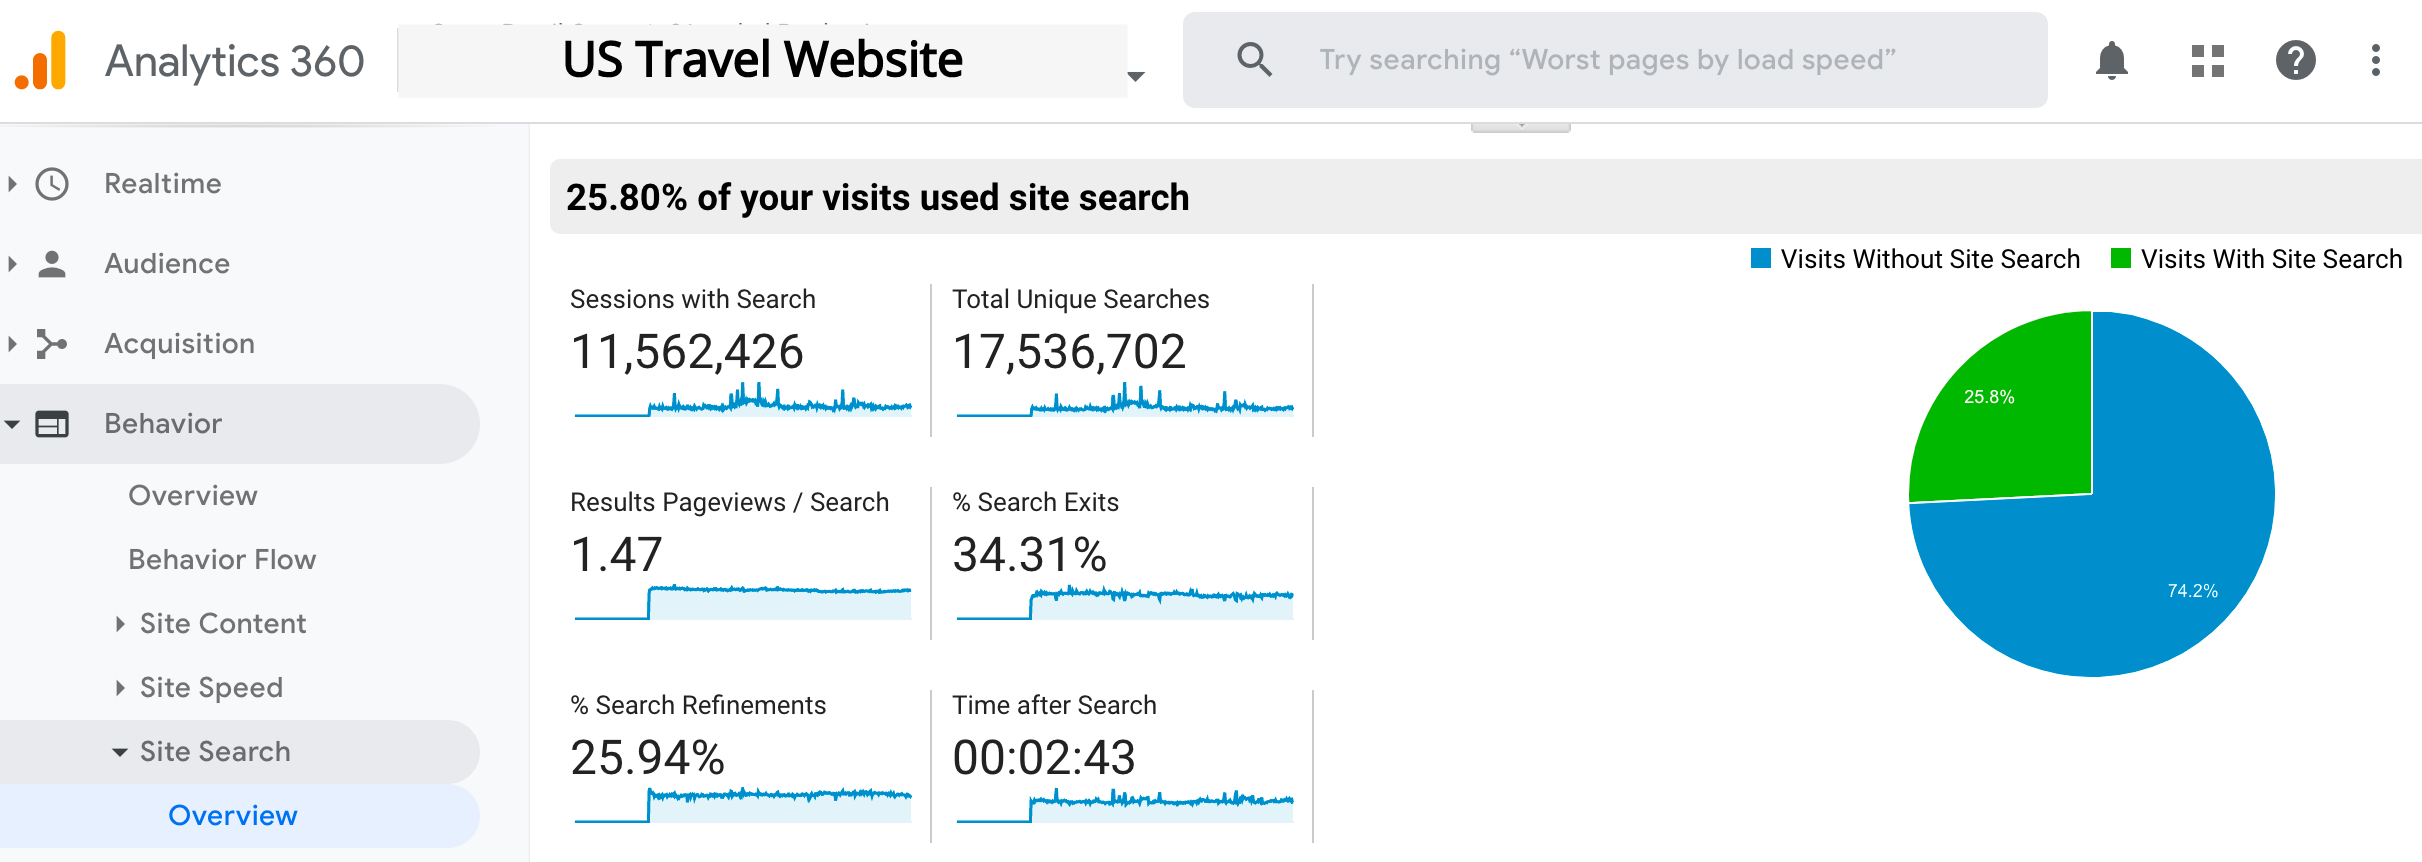
As seen in the below screenshot, one of our clients had a 25.8% of all site visits using the online site search. We see this range based on depth of the e-commerce website from 10% to 25%. Triage users using open text search is a pure engagement metric as it shows the intent of a visitor to the website. They are ‘leaning in’ and time efficient, determined to get what they are searching for. They do not want navigation tabs to meander around the site. They want the results fast and now.

travel-site-onsite-searches

Tracking engagement metrics and not just vanity metrics is an essential part of optimizing an e-commerce website.

Andy Warhol was right… I just look at pictures

In a sun-filled office in downtown Palo Alto last week I sat with another 25 executives listening to how billions of pictures are shared, tagged, annotated and federated across workflows to drive efficiency. It’s true, every workflow app now allows images to be shared in real time. And I’m not just talking about Instagram.

The team from First National Real Estate enjoyed listening to Bryan Lip, VP Partnerships  at Houzz.com – with over 2M paying designers, architects and builders who increasingly enjoy the benefits of workflow collaboration with images inside the online community platform.

image

On one of the walls inside the meeting room was this sign that images really were the vision of one of America’s greatest pop culture icons.

Screen Shot 2019-11-12 at 8.07.35 PM

And around the corner at Unami Burger on University Avenue after the meeting, I ordered up a cow free protein burger from Impossible Foods. This plant based protein alternative to meat is just a reminder that nothing really is impossible. This is America.

Screen Shot 2019-11-12 at 8.06.02 PM

How Google Events enable Website Engagement Metrics

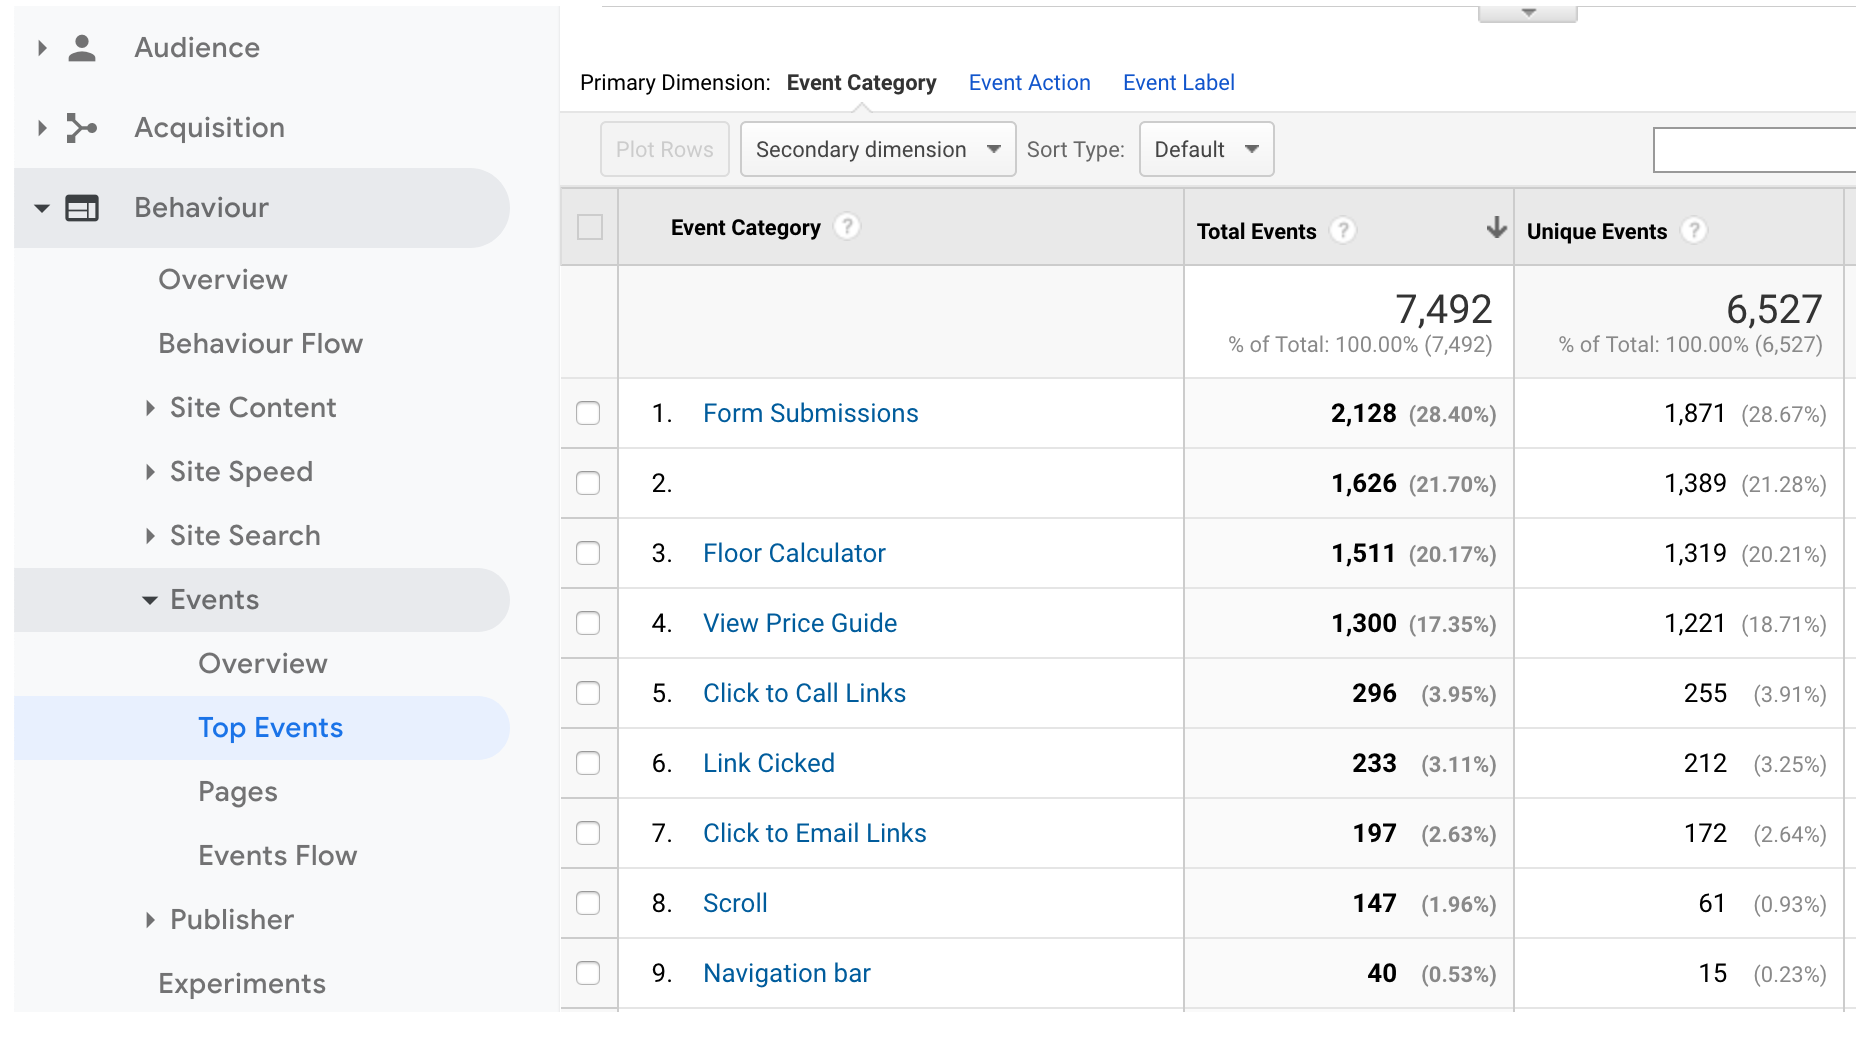
2019 has been a great year for technical webmasters and Google Analytics tech heads who want to show clients more engagement metrics. Using Google Tag Manager ‘tags’ (requires html scripting), it’s possible to show clients what ‘clicks’ are taking place on their website pages and go deeper into what elements on a page (buttons, links, images, etc) are being used by ‘users’ on each ‘page view’.

Clients like to know how many people are using their widgets like calculators, price search query tools, how many phone numbers are clicked on, forms submitted. They can then report on granular interactions across their website to management and stakeholders. One of our clients has 150 stores and this is some of the tags our skilled data scientists set up inside Google Tag Manager.Screen Shot 2019-09-14 at 8.21.08 PM


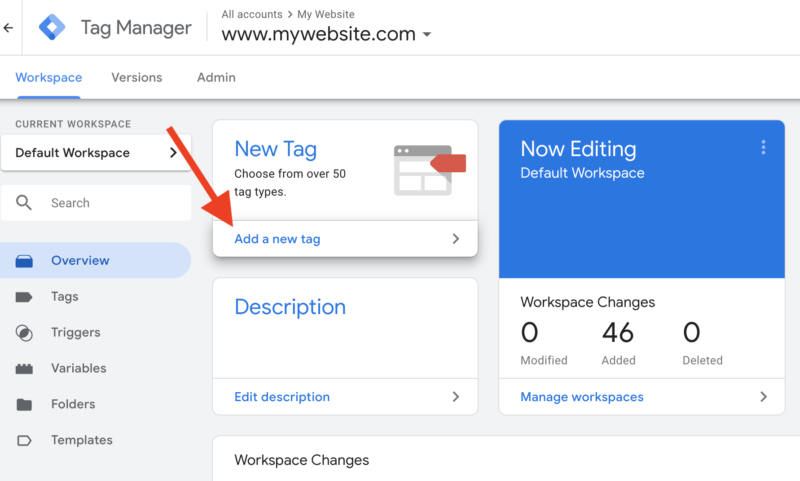
Using Google Tag Manager, it takes experienced developers who understand how to create tags and script them accordingly so they fire off the correct action and it is recorded inside Google Analytics.

gtm