E-Commerce Conversion Metrics Can Confuse Novices

Increasingly, as businesses sell more online, financial folks have to understand Google Analytics E-Commerce Conversion data. It can be confusing to those who are not familiar with it.

The most common e-commerce conversion rate is 1% – 2% that we see across the board for online retailers.

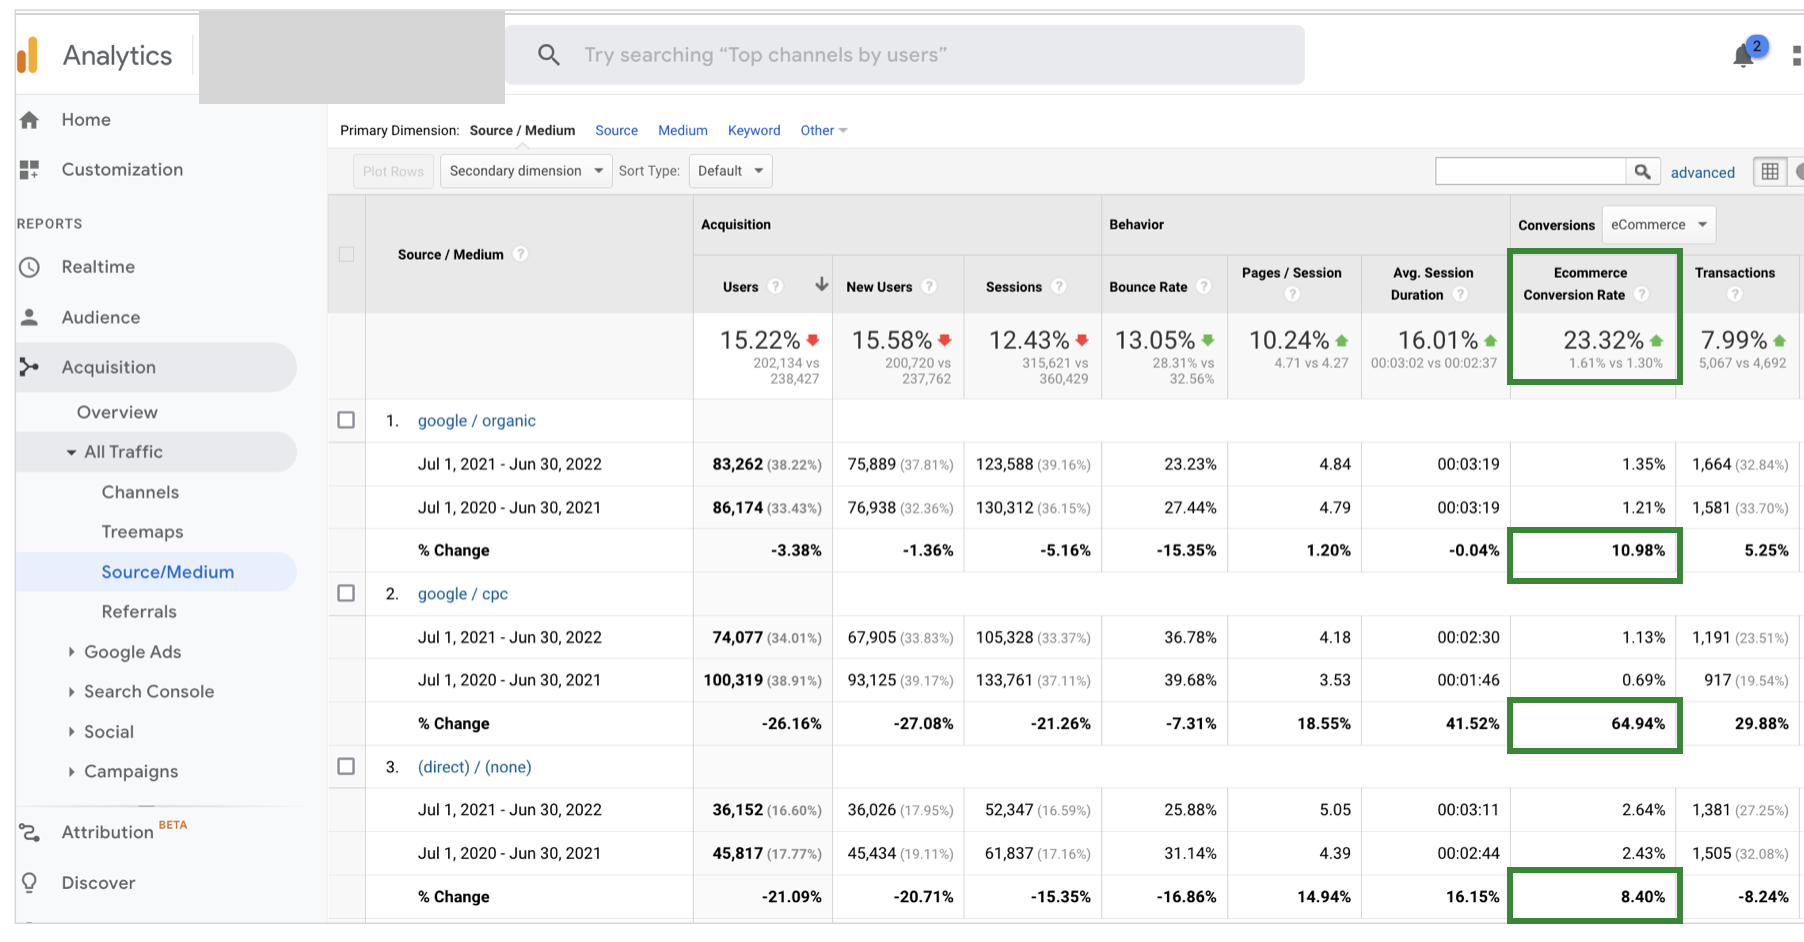
The 1.61% e-commerce conversion rate for this online retailer in the Full Year End 2022 shows the % of of visitors who come to the website and buy online. It is best to compare time series and we often show the previous financial year as a comparison. In the below Google Analytics chart, you can see this online retailer e-commerce conversion rate is up 23% overall with it being up 65% for Google paid search which shows the focus on buying / targeting relevant keywords.

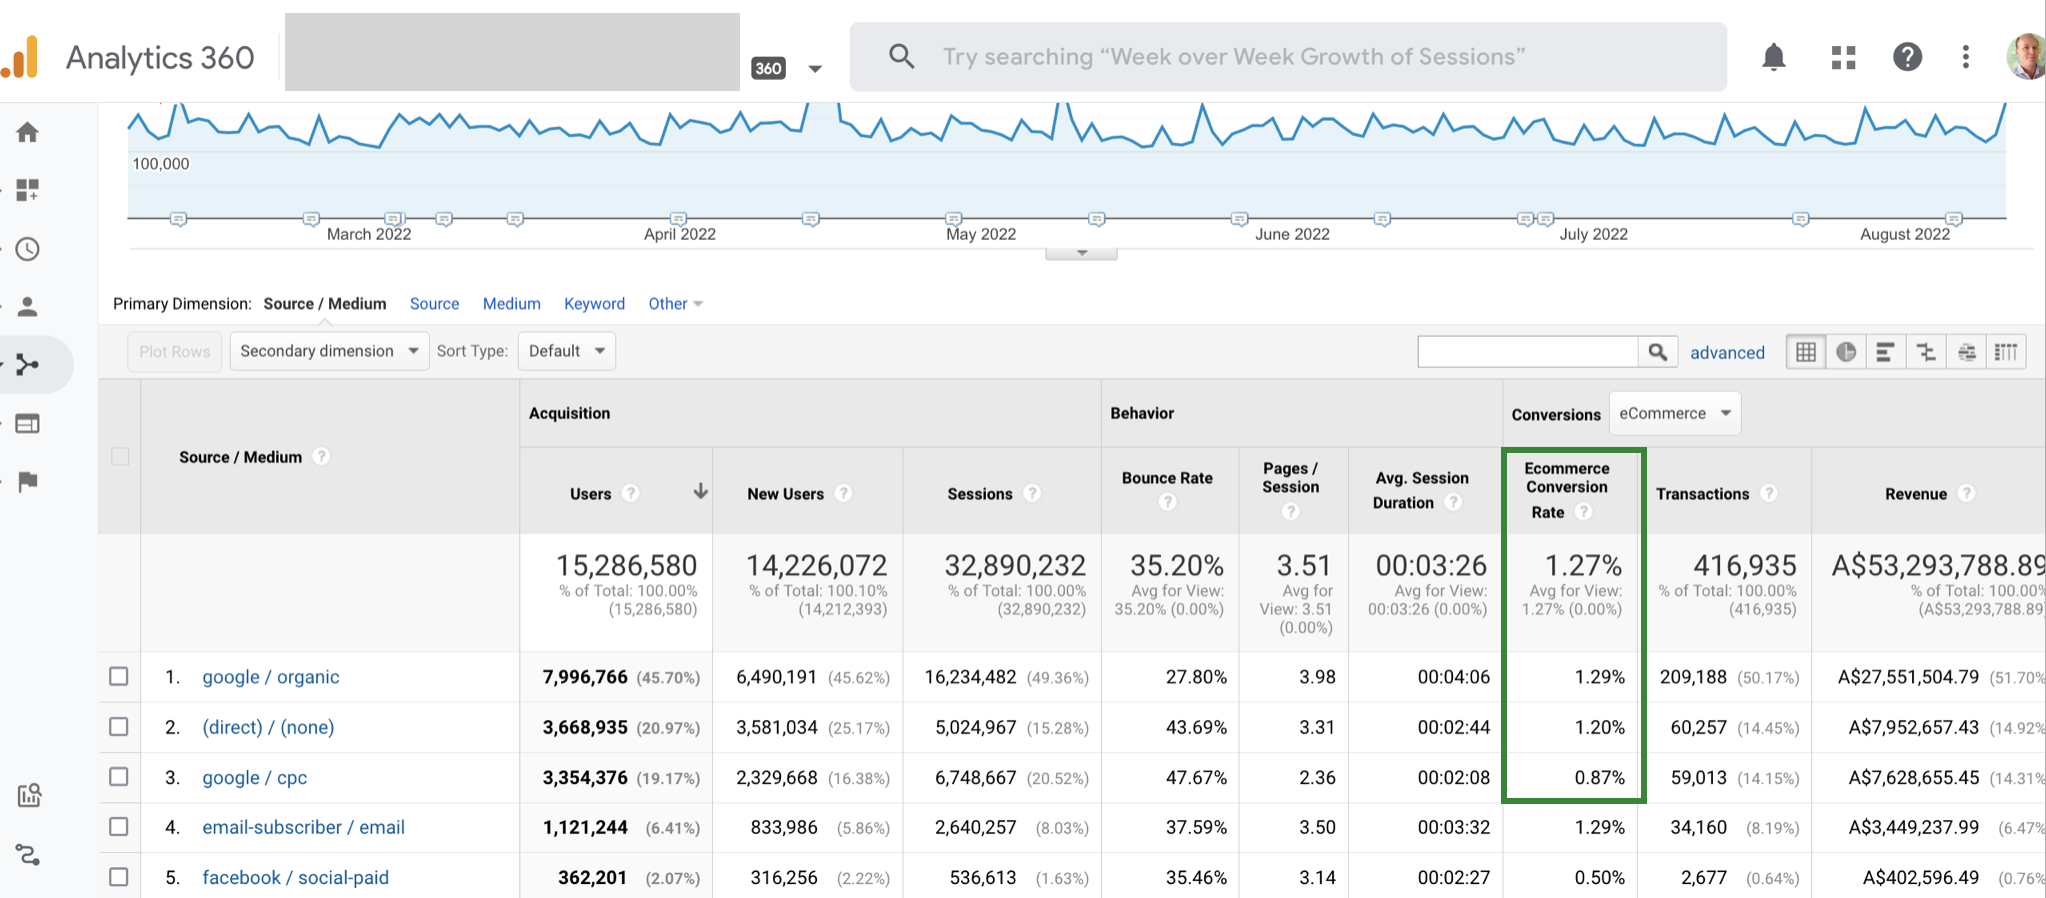
It is important to break out the e-commerce conversion rate by source / medium. Direct Traffic e-commerce conversion rates should be higher than paid and organic if the brand is strong. There is usually a higher buying intent of folks coming directly to a website than through Google Ads paid media or Google organic search queries.

conversions-google-analytics

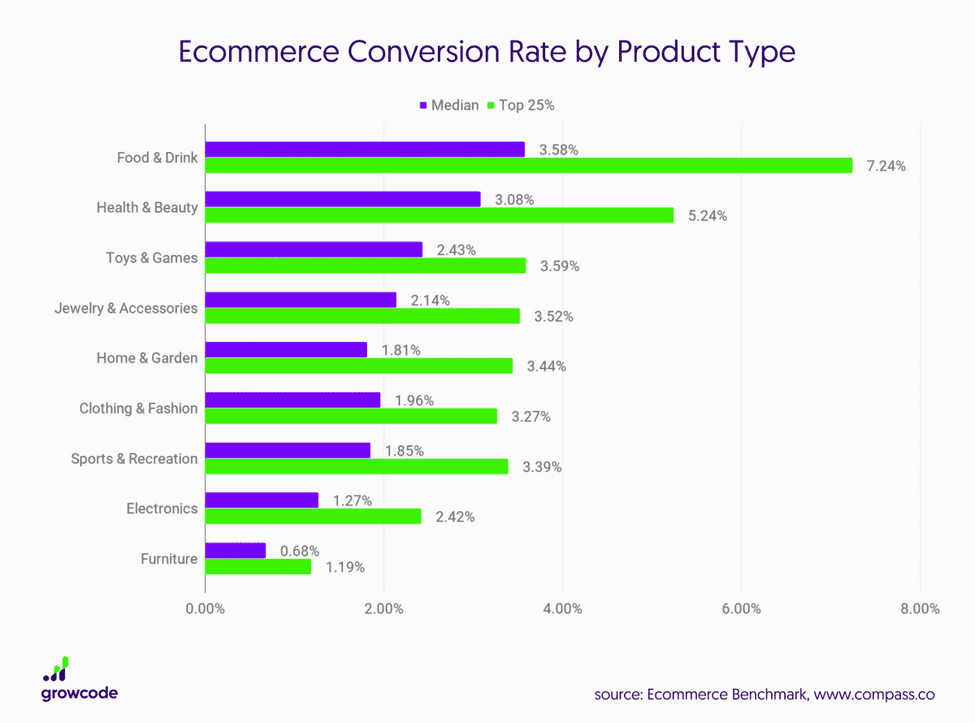
The other big factor that should be considered when analyzing e-commerce conversion rates is the price of the good. Higher order value products often have lower e-commerce conversion rates.

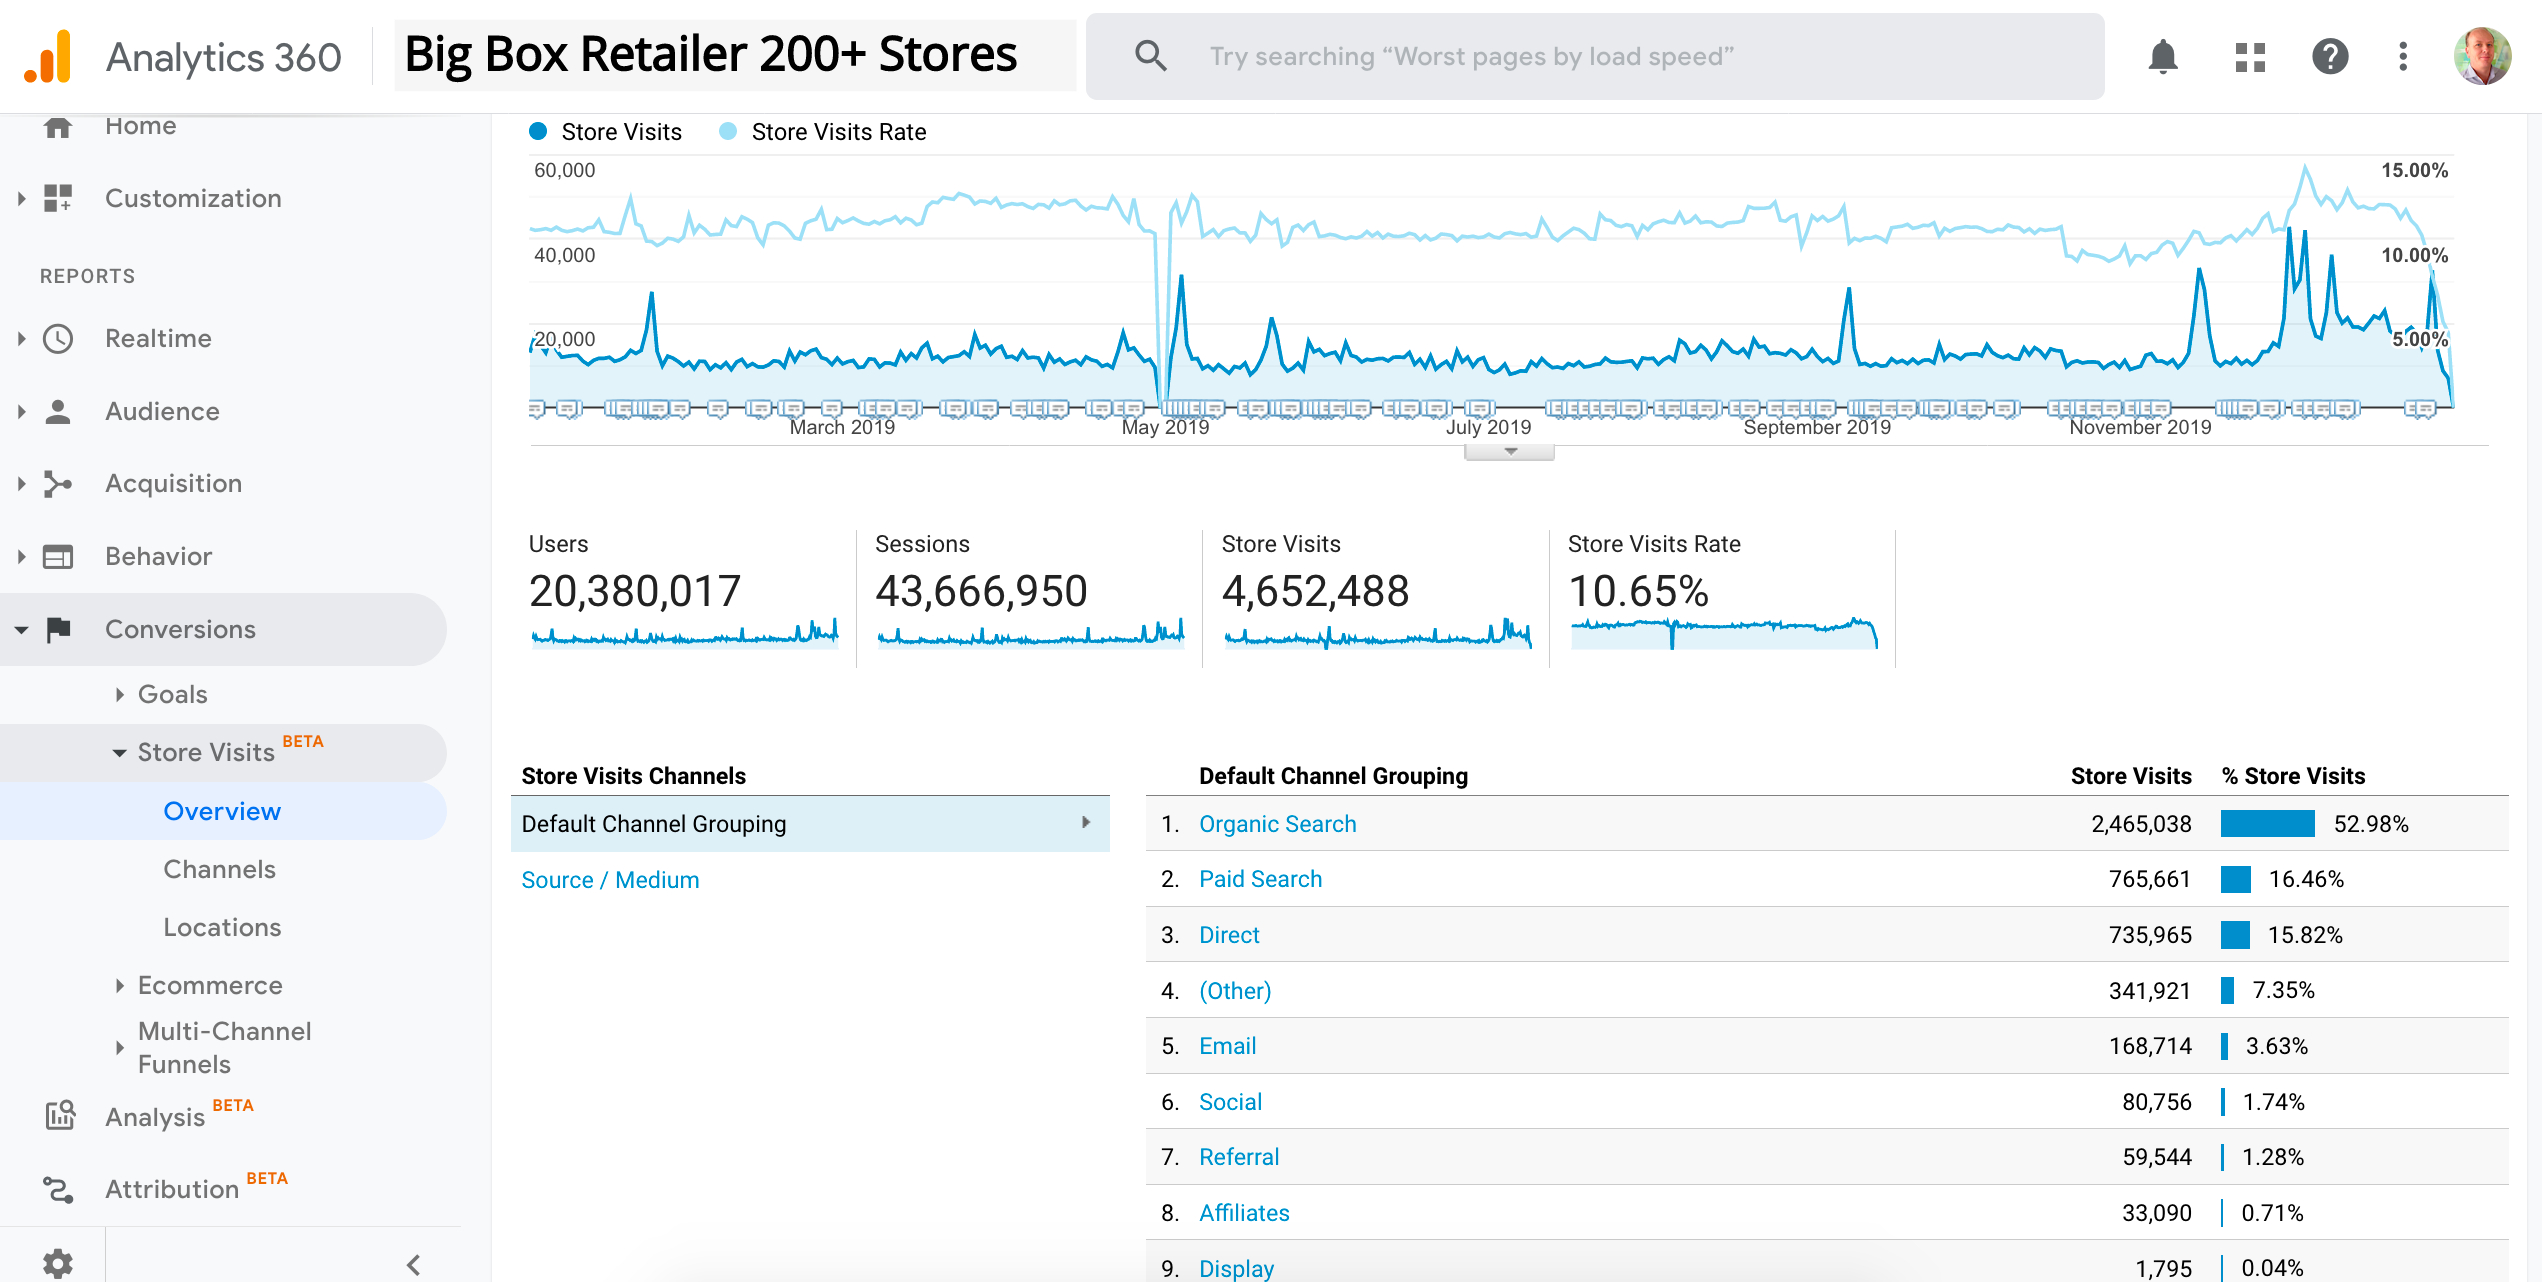
As shown in  below, this large online retailer with an average order value of $130 has a 1.27% e-commerce conversion rate That is a lower than the above online retailer who has an average order value is $780.

conversions-google-analytics1
When comparing e-commerce conversion rates to others, it depends and varies widely by industry, type of product / price, etc. I’ve included a table below which shows conversion rates by product type.
conversion-rates-by-product-type

If you are looking to improve e-commerce conversion rates, a redesign of the shopping cart pages to  reduced bounce rate and increase transactions is a good place to start.

The Inconvenient OnDemand & Micromobility Economy

In 2007, I posted this pic of Al Gore and me at Paragon restaurant on 2nd Street & Townsend in San Francisco. A few weeks back I was enjoying a coffee with friends before the San Francisco Giants ballgame when I noticed this tow truck removing the Revel scooter from 2nd Street.. It’s a local rule to clear traffic around the ballpark on game days for obvious reasons.

Having had my car towed from the Sansome Street in the city years ago, I know the $350++ fine awaits as per SFMTA. What is interesting is that the on demand economy sometimes doesn’t interact with the offline economy. I’ve seen Lime Bikes in trees and one in a creek in Menlo Park!

Some more work to do for the engineers at these companies …

towaway

Top E-Commerce Engagement Metrics

Deep inside the minds of most analytically trained people is the curious trait that questions performance – both offline and online. Google Analytics provides increasing insight for optimization of user engagement. Here’s a look at several of the engagement metrics to be aware of and insights:

1. Organic Search Drives 50% of Store Traffic for Retailers.

As seen in the below screenshot, one of our clients websites (with over 200 retail stores) had over 20 million user sessions in 2019. 52% of store visits resulted from those who visited their website from an organic search listing. 10% of all user sessions resulted in 1 store visit. This is a key ‘engagement metric’ and one all omni retail channel managers should be tracking.

big-box-retailer

2. Optimized Page Length for Conversions

As seen in the below screenshot, one of our clients had a $61M turnover in from Jan 1 to Dec 31, 2019 and the number of pages it took to convert 46% of conversions was 1-2 pages. In e-commerce, product page optimization is critical. Shoppers are impulsive and expect all the information to be on one page (product reviews, price, delivery, guarantee, promotional price, etc). The key is to focus on the product page and make that perfect as online shoppers are fickle and dont want to click around the site unnecessarily.

Screen Shot 2019-12-30 at 3.56.59 PM

3. Onsite Searches as a % of Total Users

As seen in the below screenshot, one of our clients had a 25.8% of all site visits using the online site search. We see this range based on depth of the e-commerce website from 10% to 25%. Triage users using open text search is a pure engagement metric as it shows the intent of a visitor to the website. They are ‘leaning in’ and time efficient, determined to get what they are searching for. They do not want navigation tabs to meander around the site. They want the results fast and now.

travel-site-onsite-searches

Tracking engagement metrics and not just vanity metrics is an essential part of optimizing an e-commerce website.