Deep inside the minds of most analytically trained people is the curious trait that questions performance – both offline and online. Google Analytics provides increasing insight for optimization of user engagement. Here’s a look at several of the engagement metrics to be aware of and insights:
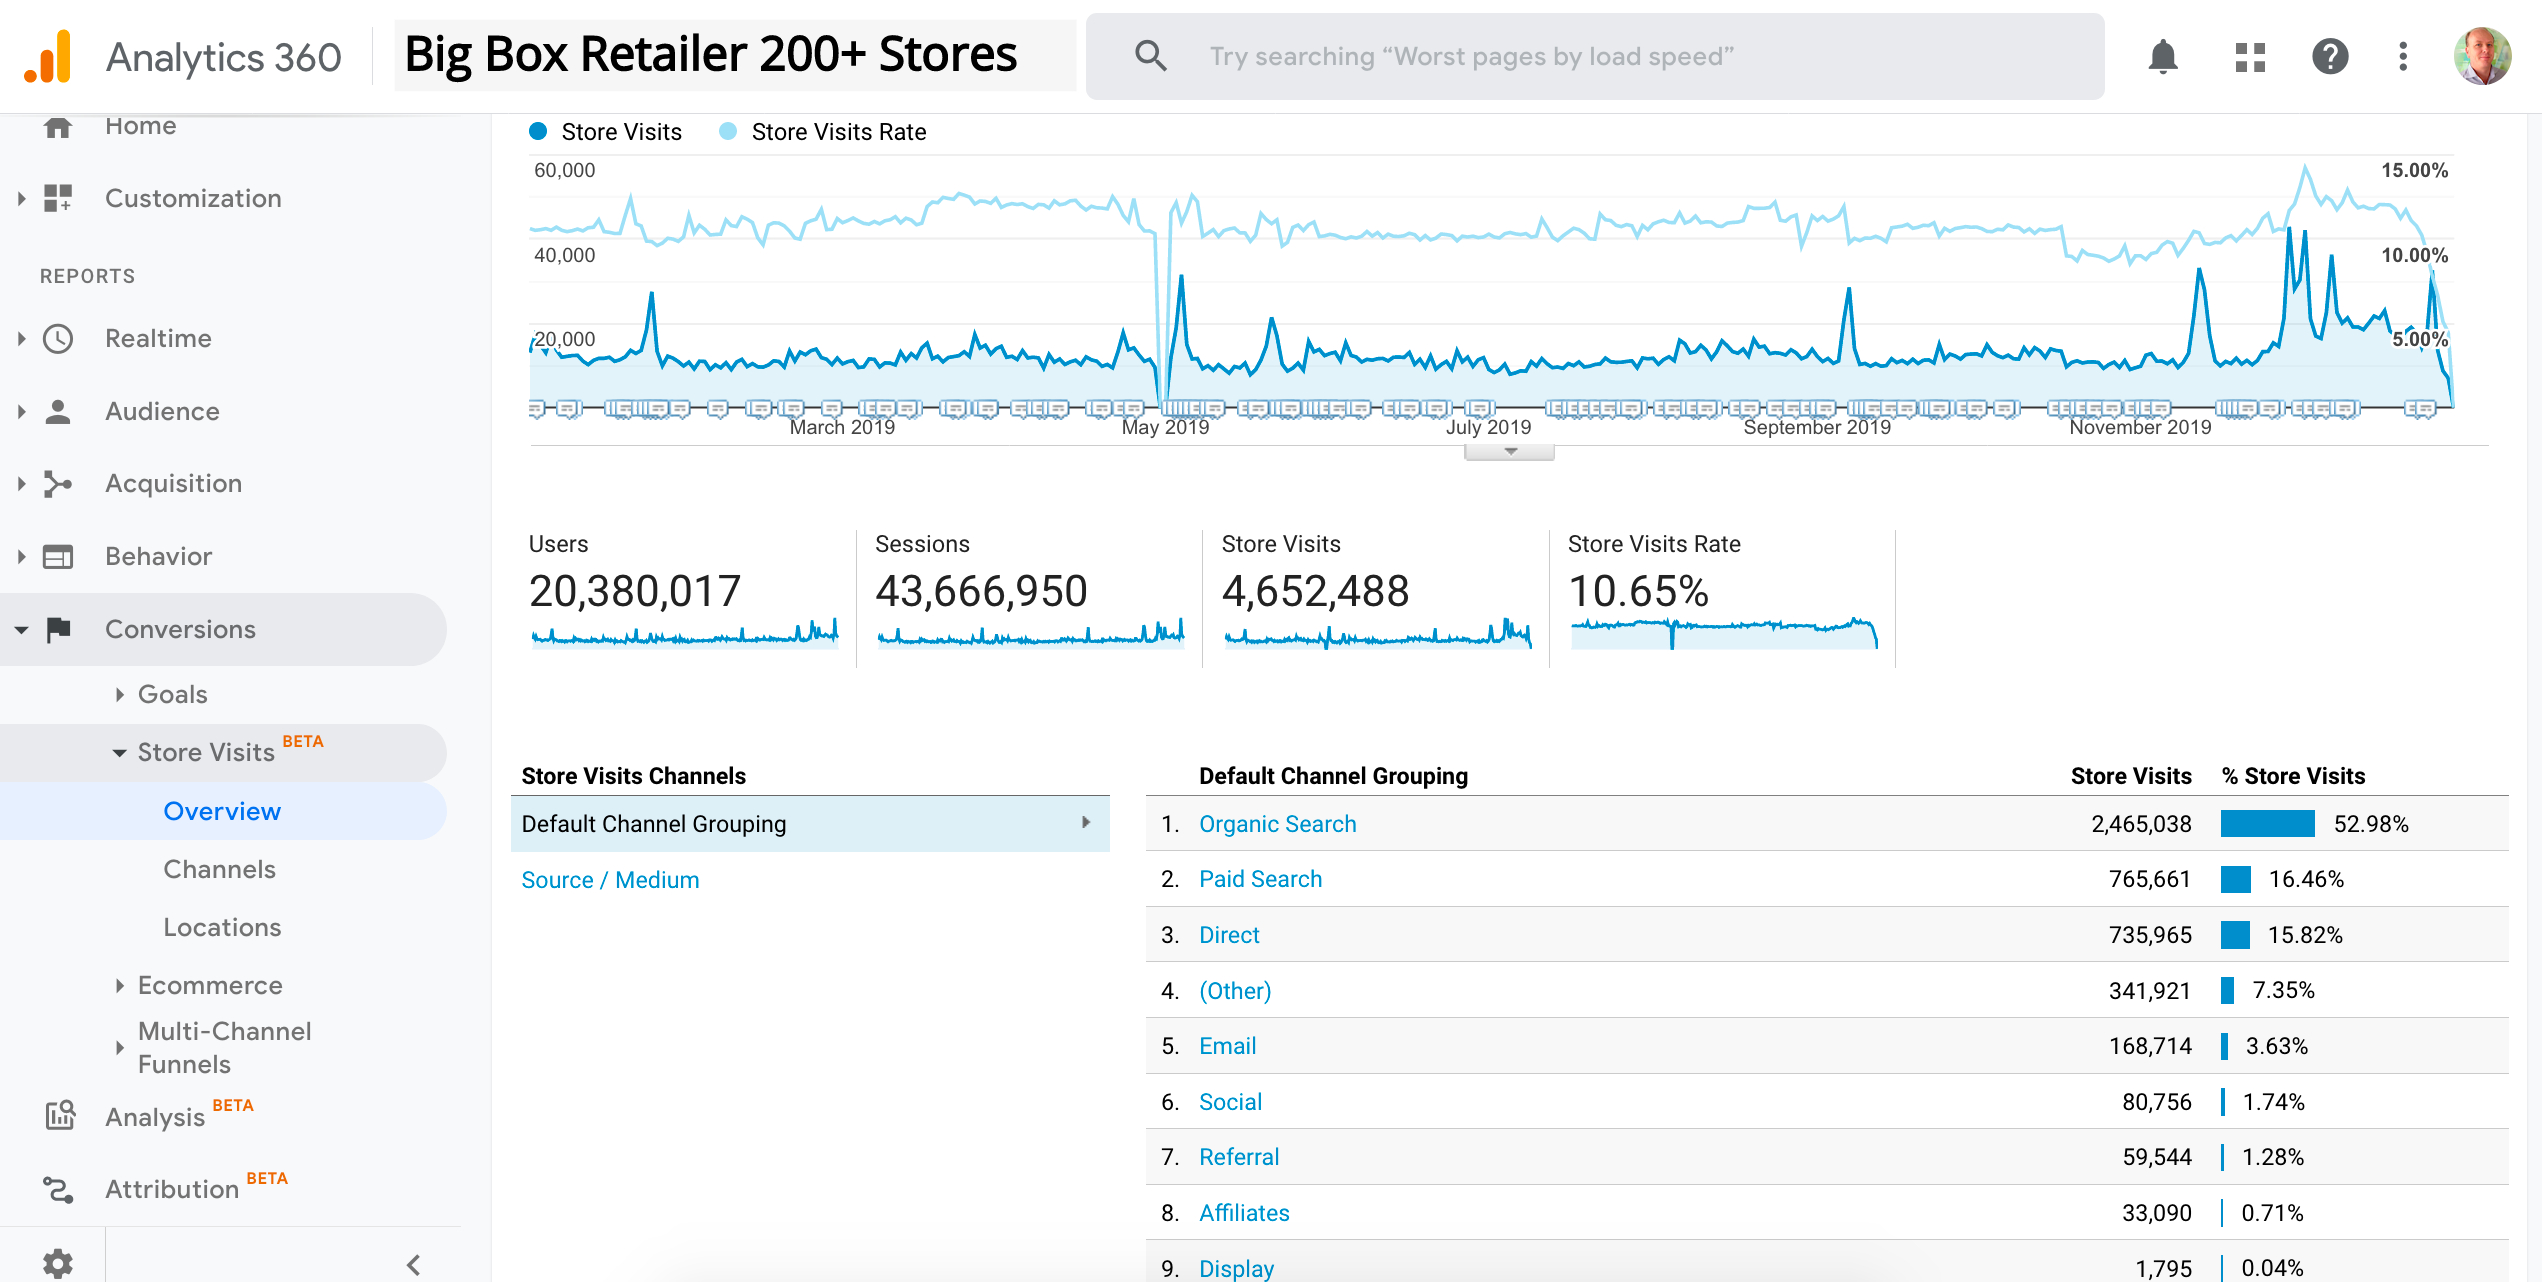
1. Organic Search Drives 50% of Store Traffic for Retailers.
As seen in the below screenshot, one of our clients websites (with over 200 retail stores) had over 20 million user sessions in 2019. 52% of store visits resulted from those who visited their website from an organic search listing. 10% of all user sessions resulted in 1 store visit. This is a key ‘engagement metric’ and one all omni retail channel managers should be tracking.
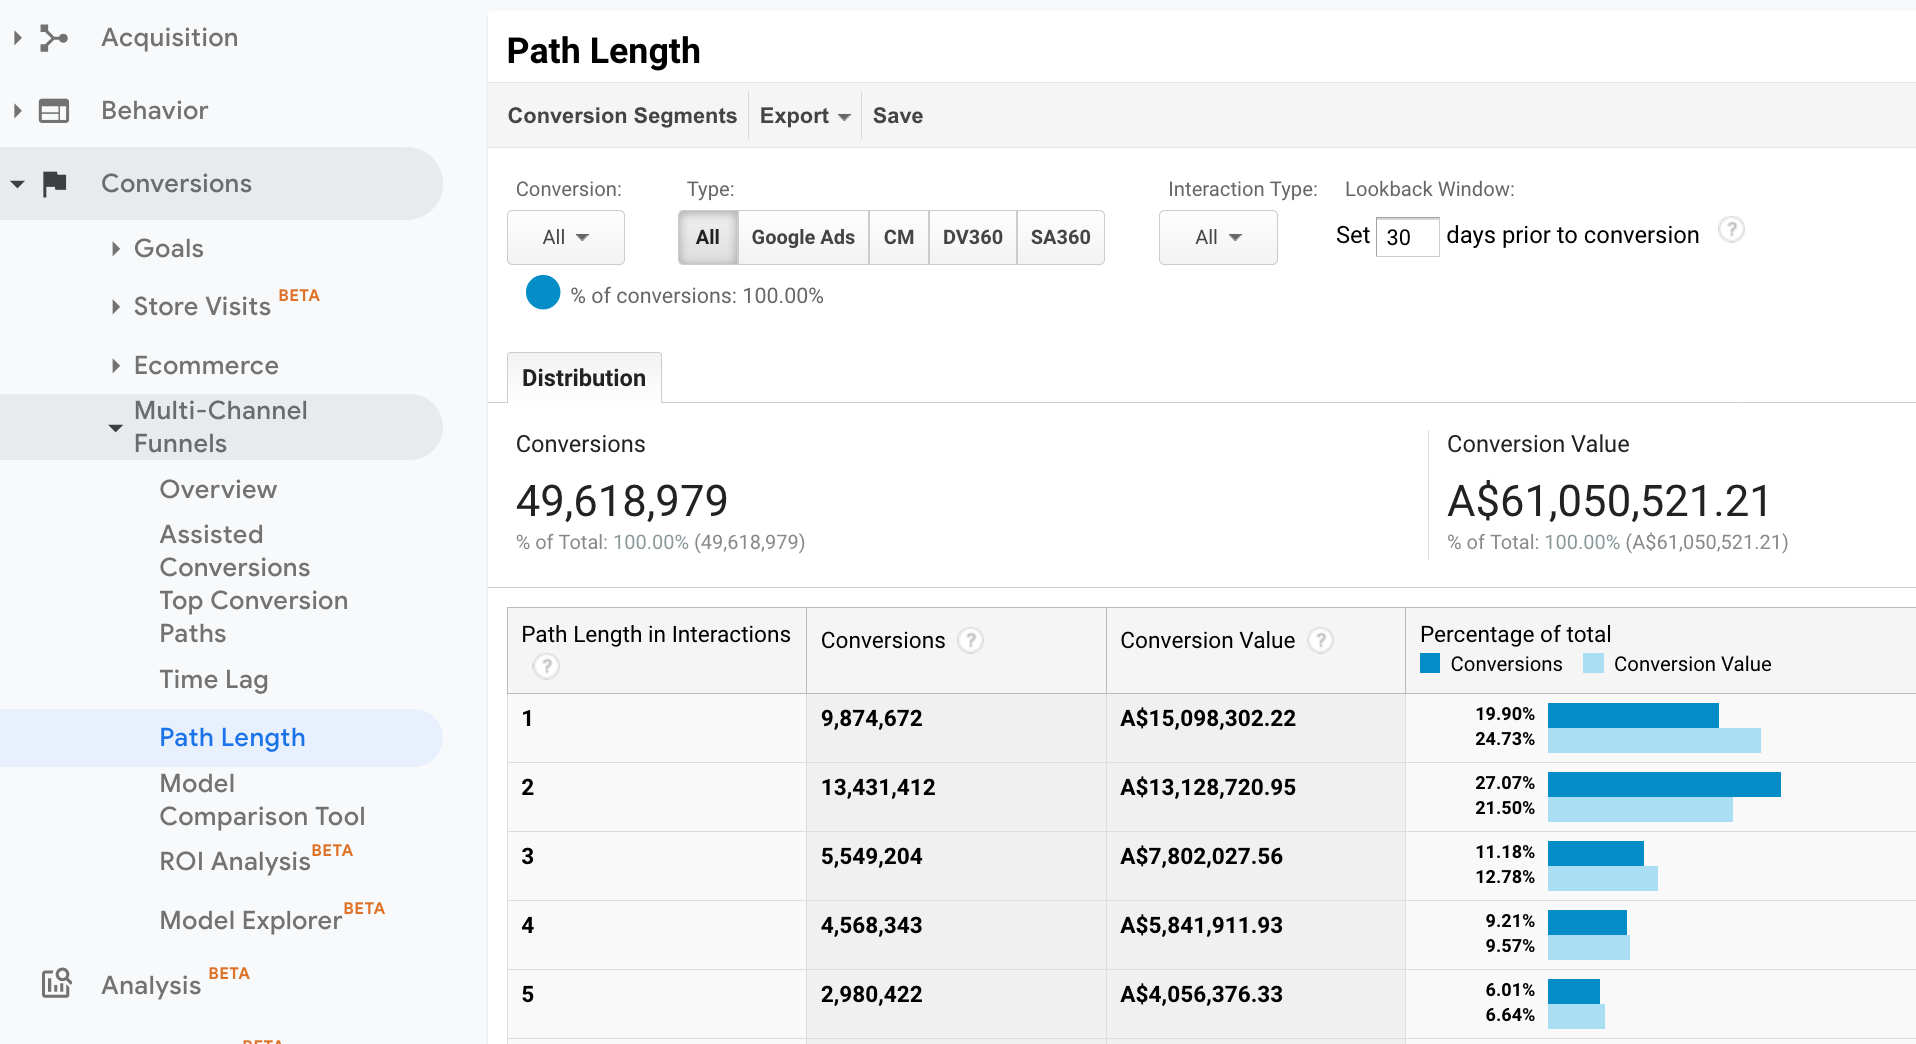
2. Optimized Page Length for Conversions
As seen in the below screenshot, one of our clients had a $61M turnover in from Jan 1 to Dec 31, 2019 and the number of pages it took to convert 46% of conversions was 1-2 pages. In e-commerce, product page optimization is critical. Shoppers are impulsive and expect all the information to be on one page (product reviews, price, delivery, guarantee, promotional price, etc). The key is to focus on the product page and make that perfect as online shoppers are fickle and dont want to click around the site unnecessarily.
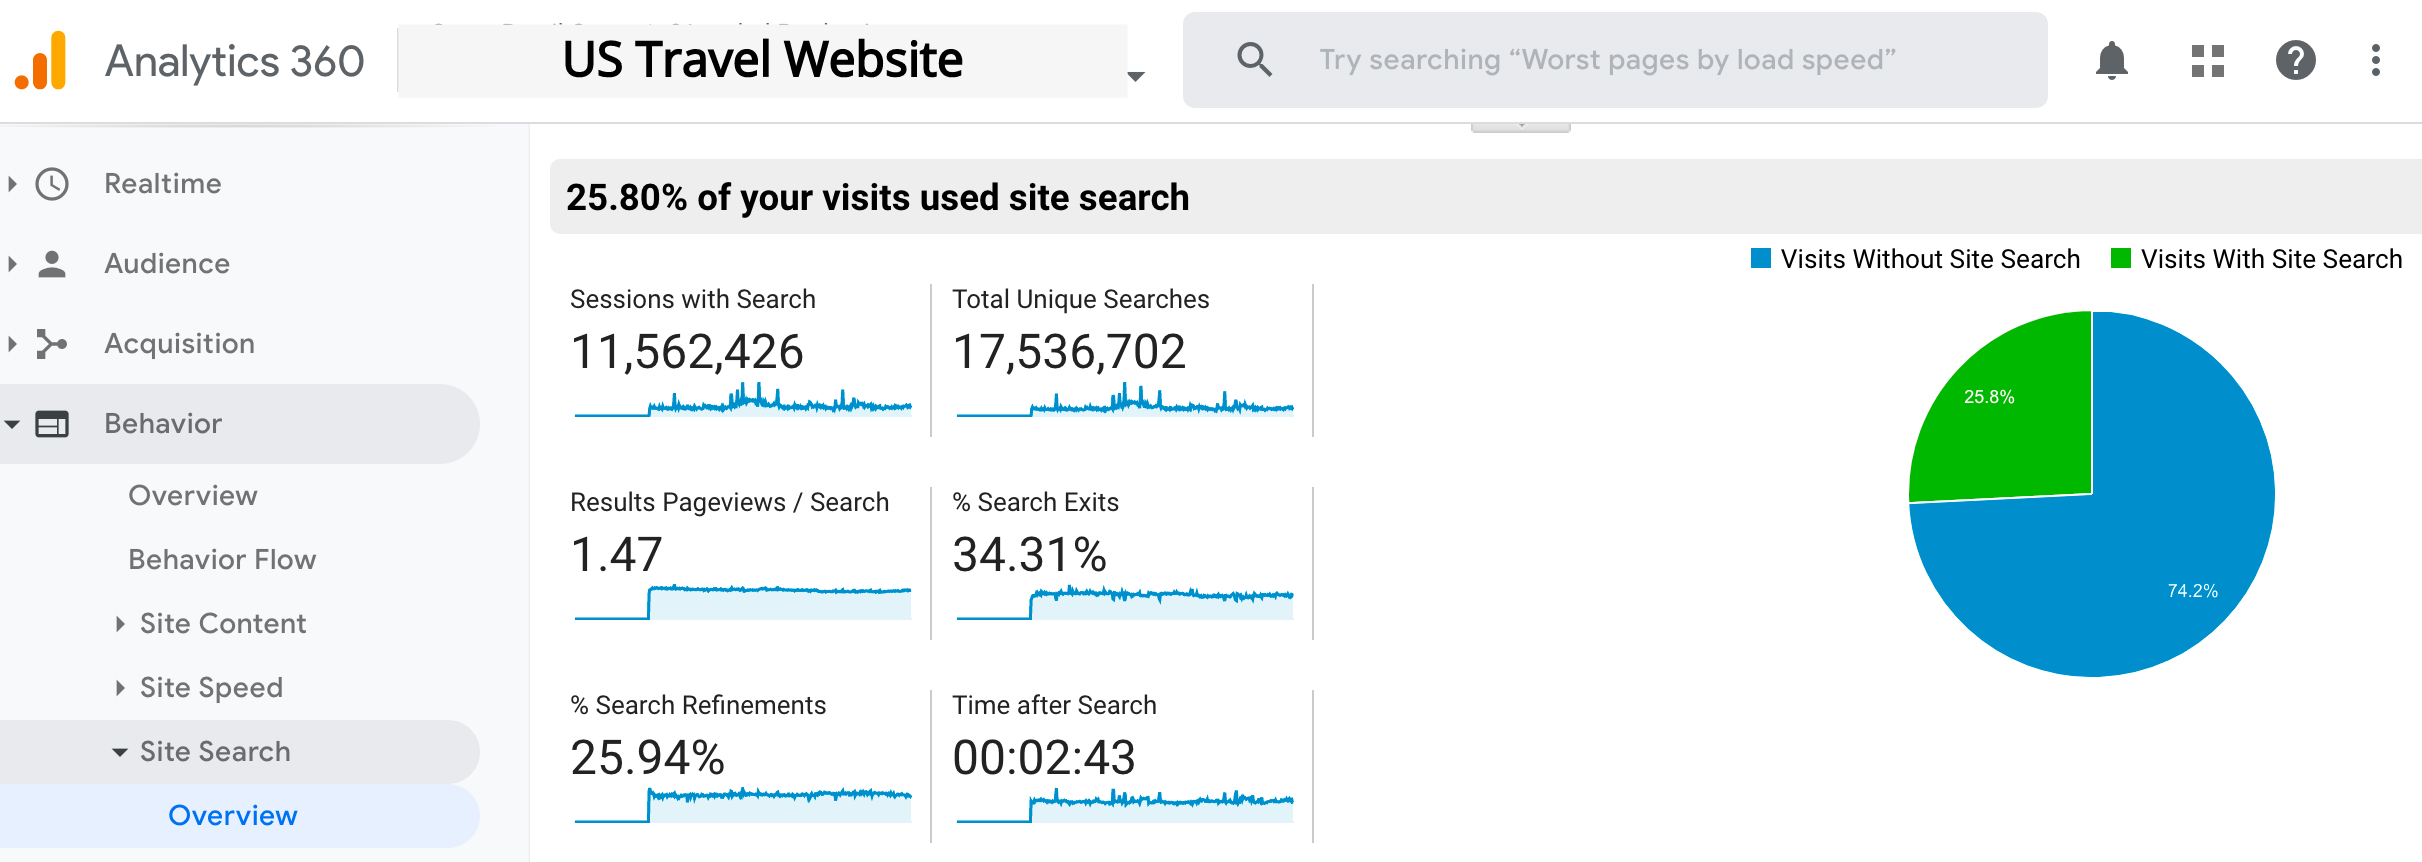
3. Onsite Searches as a % of Total Users
As seen in the below screenshot, one of our clients had a 25.8% of all site visits using the online site search. We see this range based on depth of the e-commerce website from 10% to 25%. Triage users using open text search is a pure engagement metric as it shows the intent of a visitor to the website. They are ‘leaning in’ and time efficient, determined to get what they are searching for. They do not want navigation tabs to meander around the site. They want the results fast and now.
Tracking engagement metrics and not just vanity metrics is an essential part of optimizing an e-commerce website.


