Increasingly, as businesses sell more online, financial folks have to understand Google Analytics E-Commerce Conversion data. It can be confusing to those who are not familiar with it.
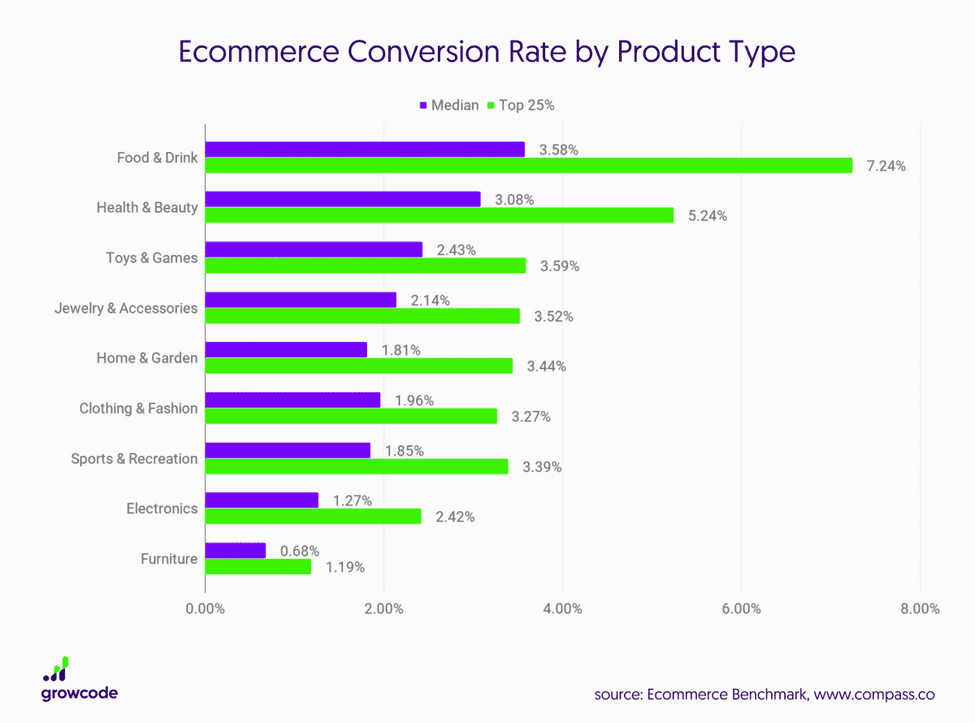
The most common e-commerce conversion rate is 1% – 2% that we see across the board for online retailers.
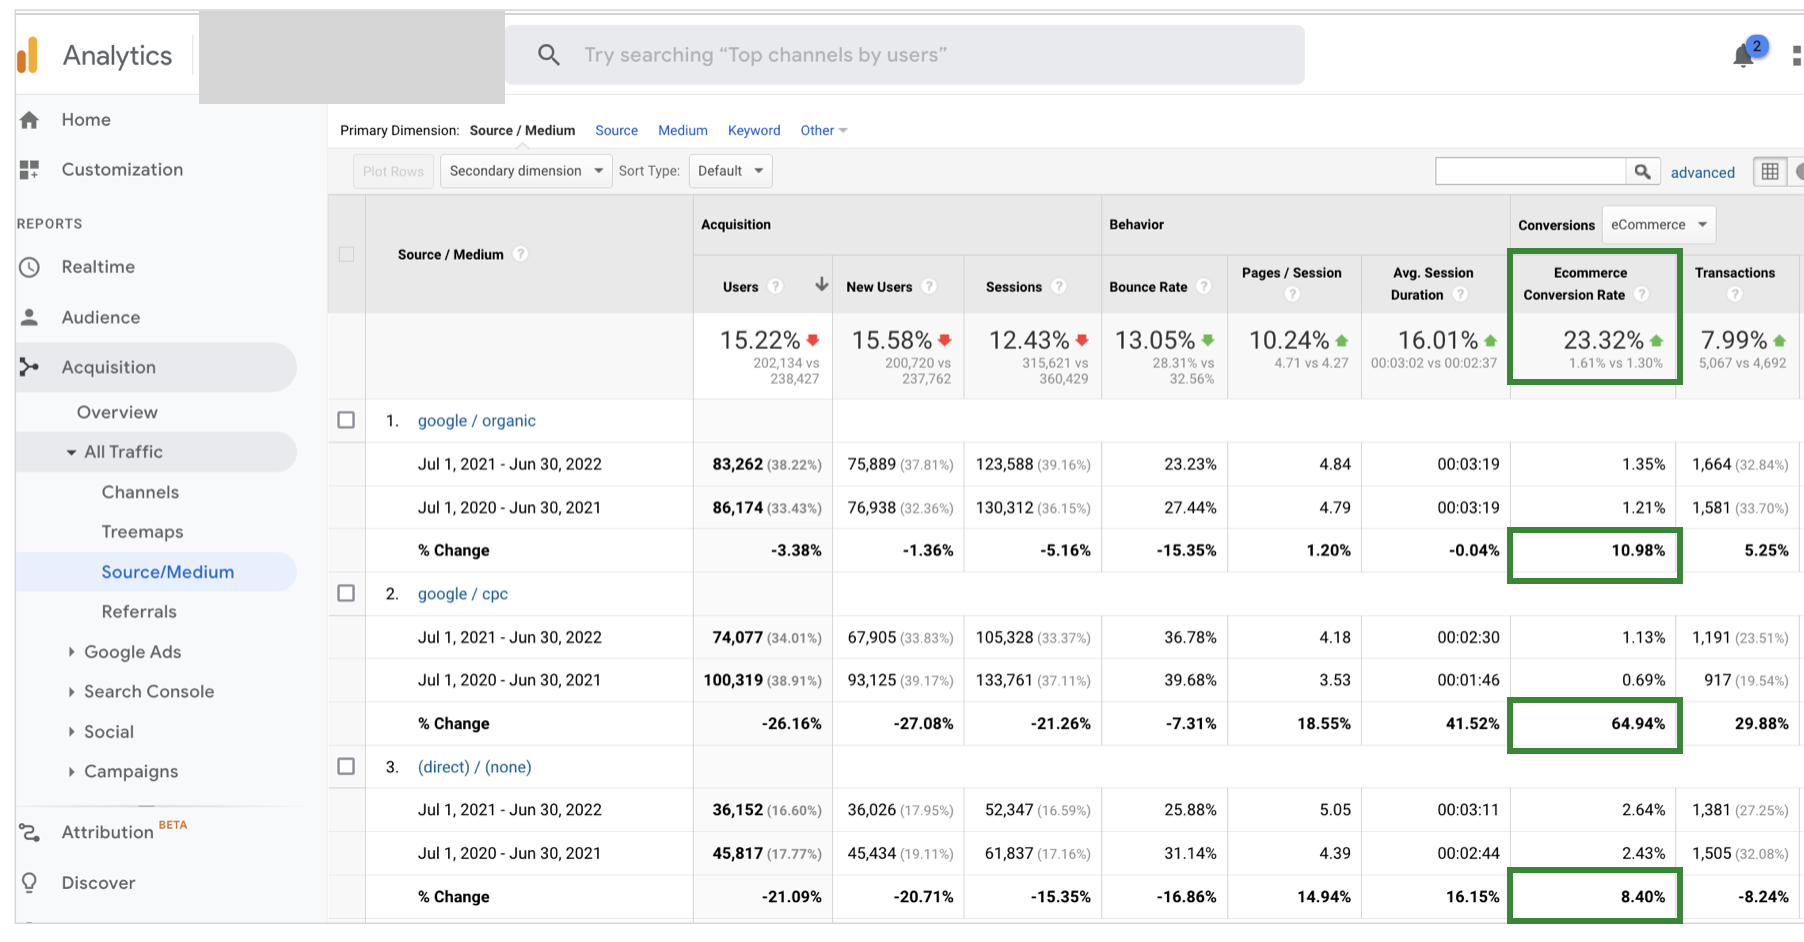
The 1.61% e-commerce conversion rate for this online retailer in the Full Year End 2022 shows the % of of visitors who come to the website and buy online. It is best to compare time series and we often show the previous financial year as a comparison. In the below Google Analytics chart, you can see this online retailer e-commerce conversion rate is up 23% overall with it being up 65% for Google paid search which shows the focus on buying / targeting relevant keywords.
It is important to break out the e-commerce conversion rate by source / medium. Direct Traffic e-commerce conversion rates should be higher than paid and organic if the brand is strong. There is usually a higher buying intent of folks coming directly to a website than through Google Ads paid media or Google organic search queries.
The other big factor that should be considered when analyzing e-commerce conversion rates is the price of the good. Higher order value products often have lower e-commerce conversion rates.
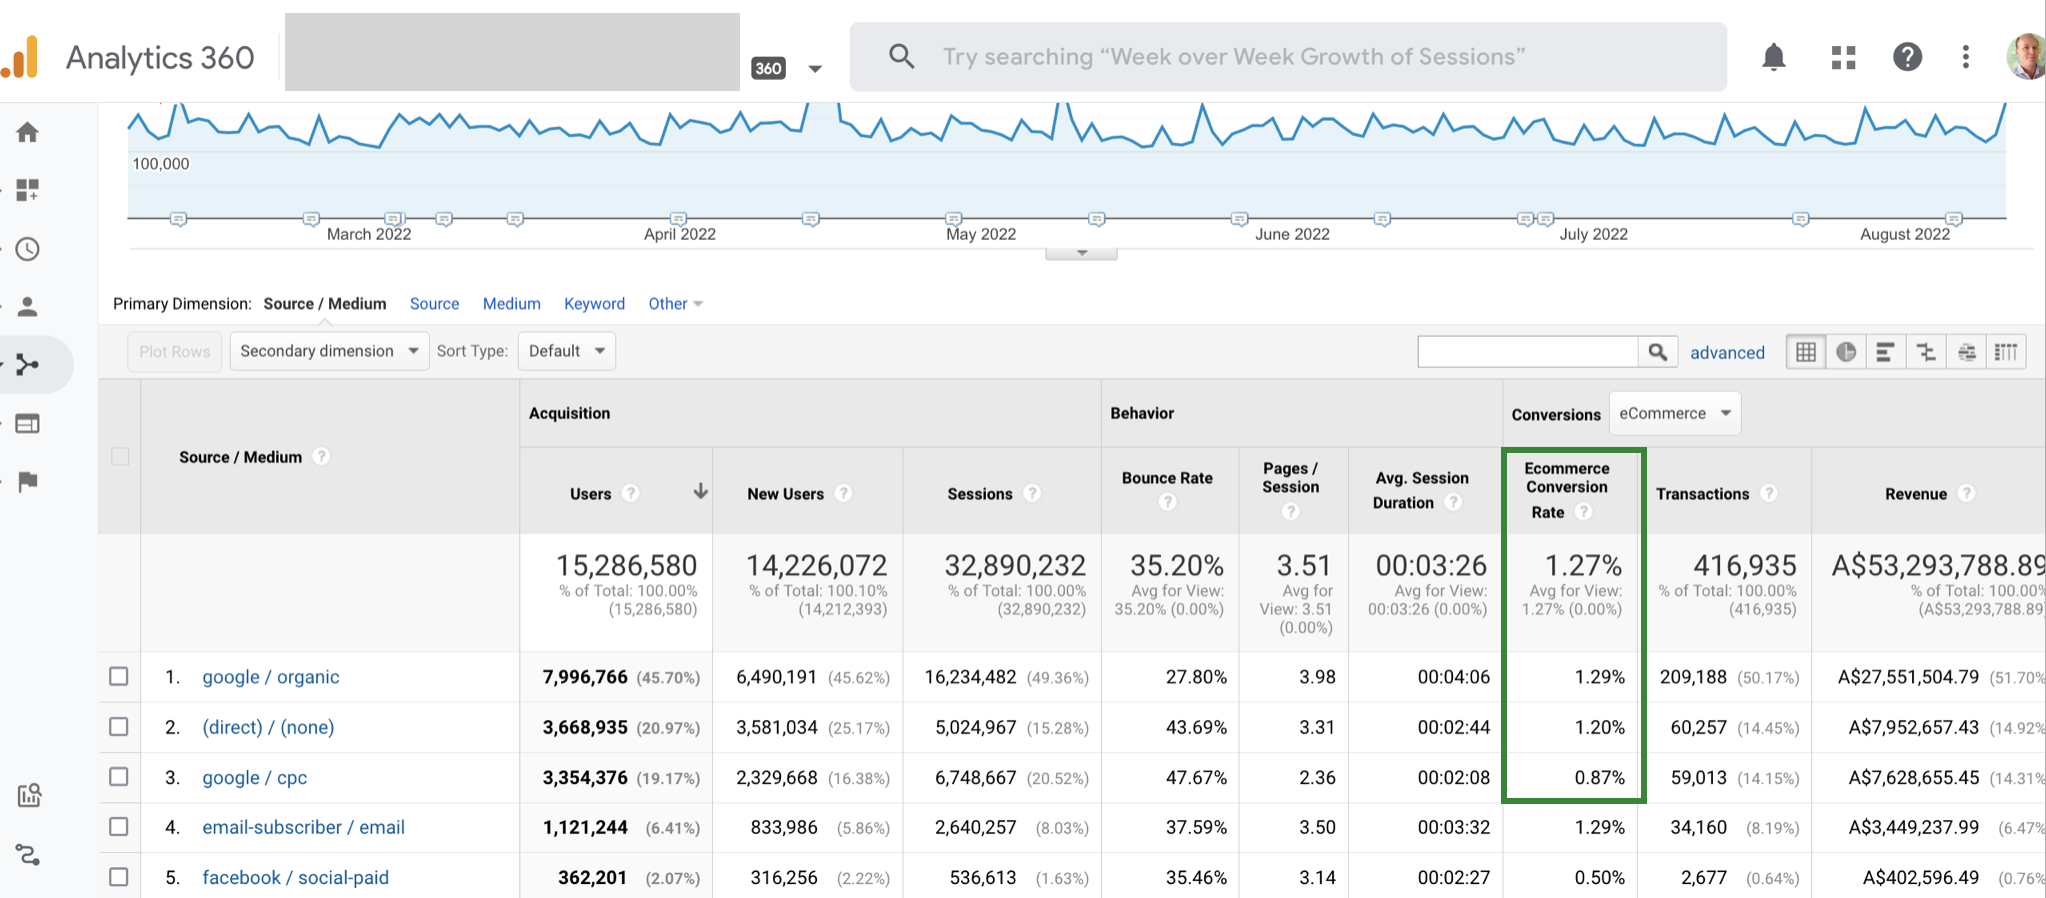
As shown in below, this large online retailer with an average order value of $130 has a 1.27% e-commerce conversion rate That is a lower than the above online retailer who has an average order value is $780.
If you are looking to improve e-commerce conversion rates, a redesign of the shopping cart pages to reduced bounce rate and increase transactions is a good place to start.


