Lockdown Tips for Audiences

Covid is giving us more time to do many more things. Now we’re not commuting, entertaining or hanging out at conferences, we’re pouring over more of the features inside dashboards that drive customers to our clients websites. One simple suggestion for online traffic optimization experts is to create Audiences inside Google Analytics and then target those audiences inside Google Ads to create more targeted audiences seeing more focused ads.

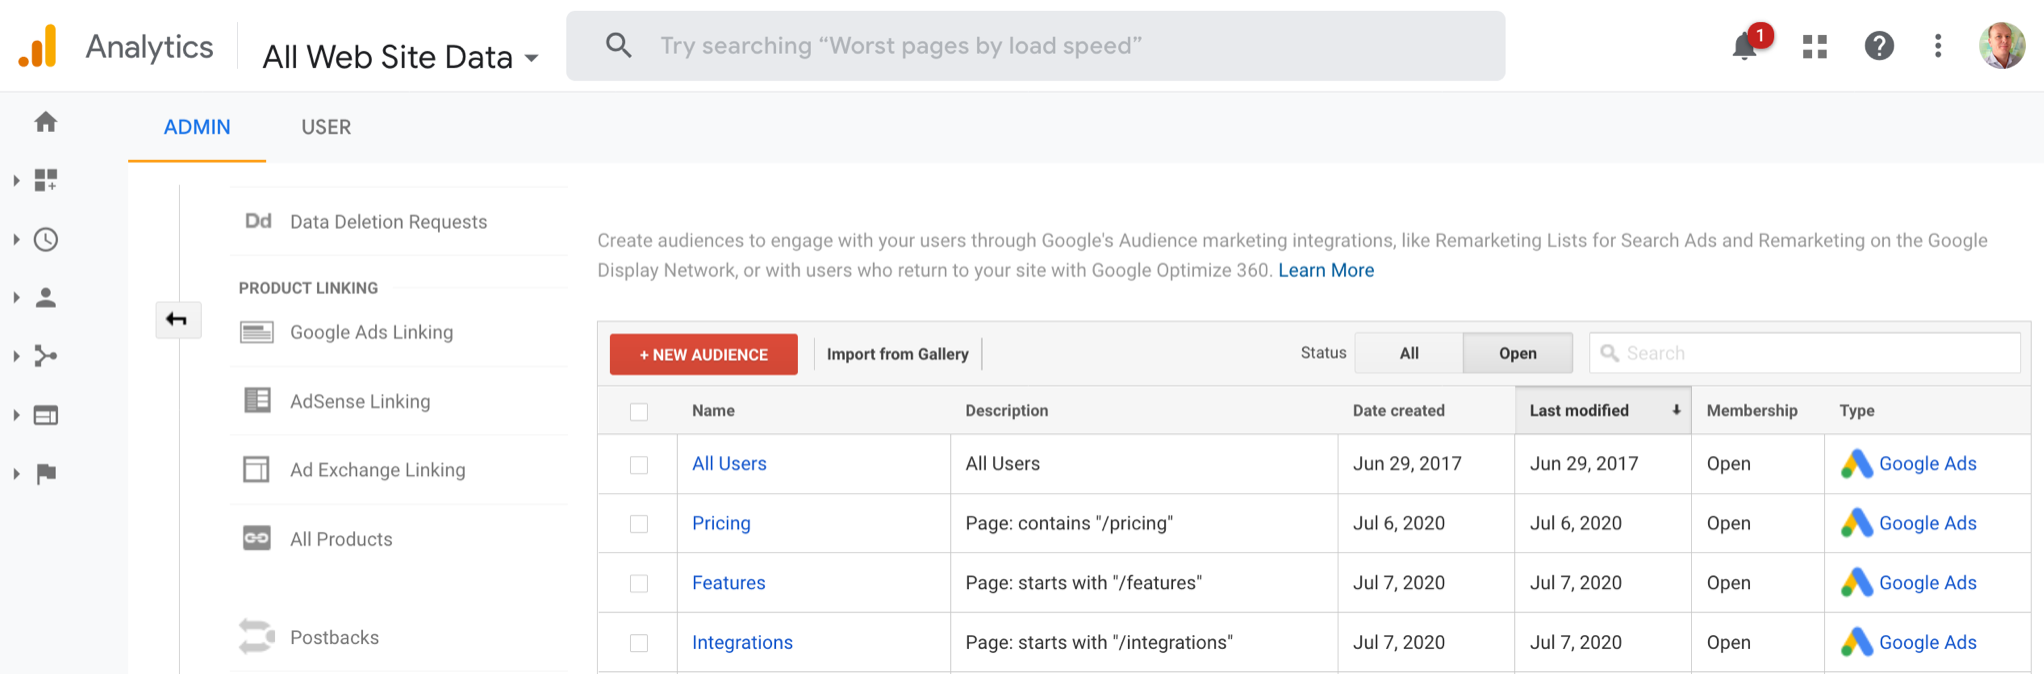
Here’s an example for one of our software clients. You can see audiences were created for key sections of their website (pricing page, features pages and integrations pages). You can create Audiences in the Google Analytics > Admin > Property section (click on the menu ‘Audience Definitions > Audiences) and then create them using the URL string for each section of the site you wish to segment an audience for. You can select Google Ads as were you want the Audience to be imported to.

Screen Shot 2020-08-16 at 12.12.11 AM

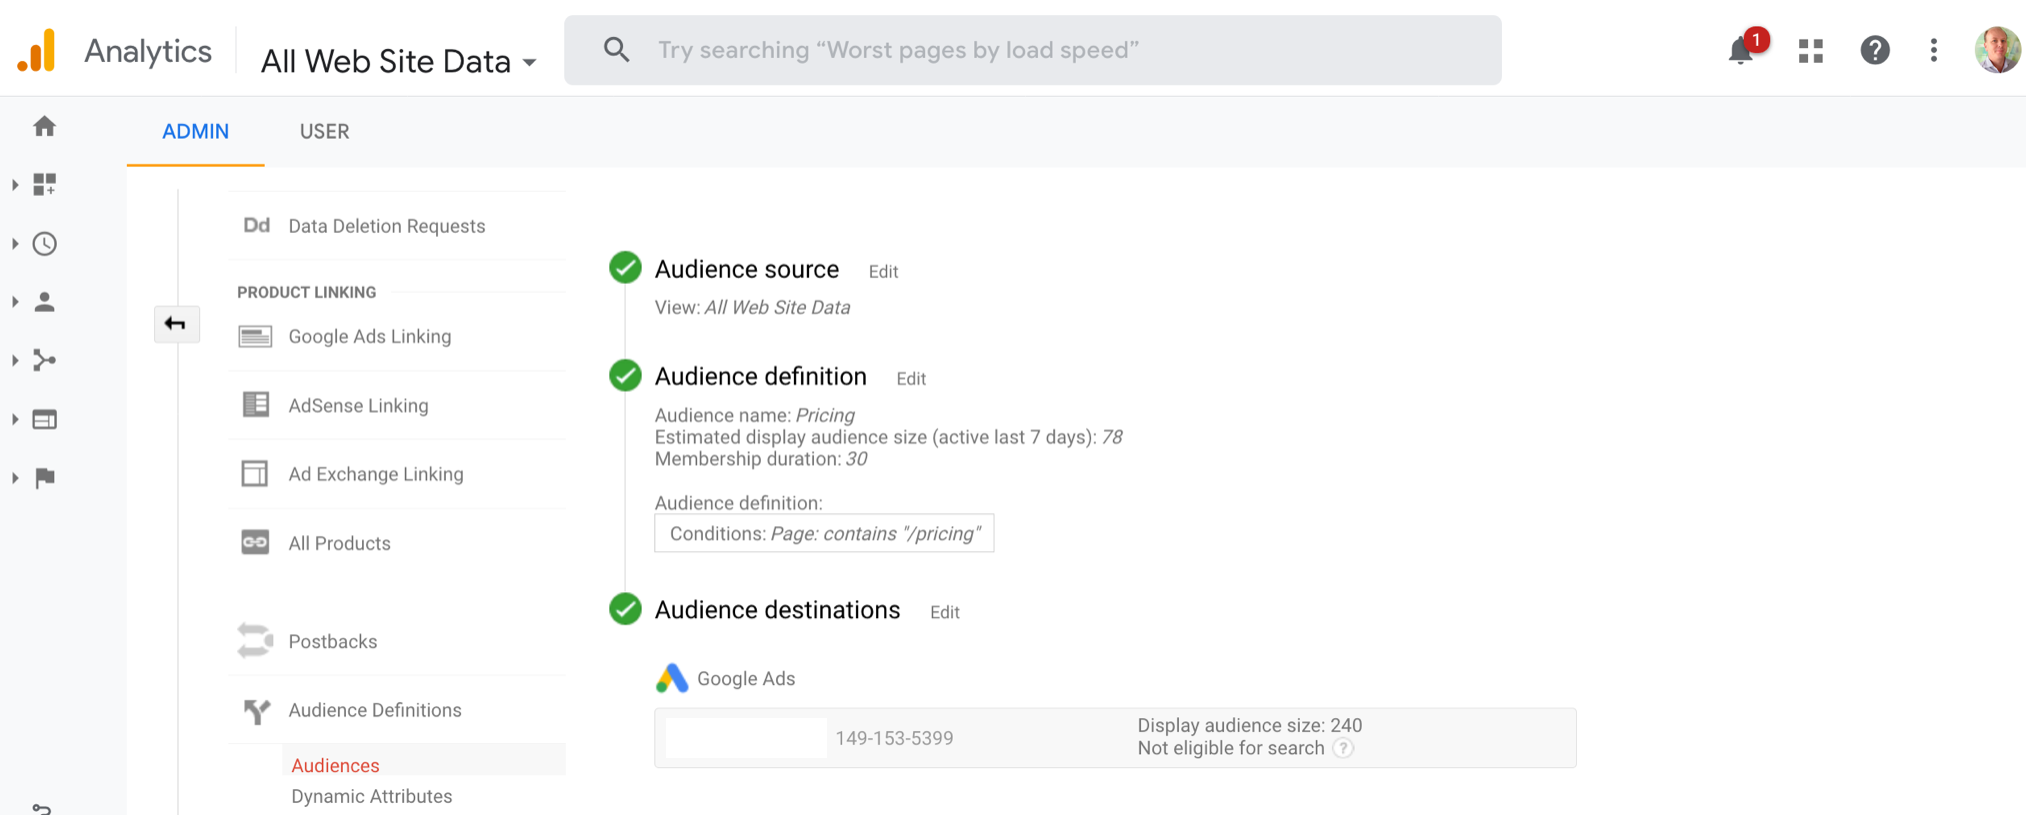
Over time, Google will keep count of the visitors to those section/s of the website and when there is enough traffic, they will publish the audience number. You can see below the Display Audience is 240.

Screen Shot 2020-08-16 at 12.19.25 AM

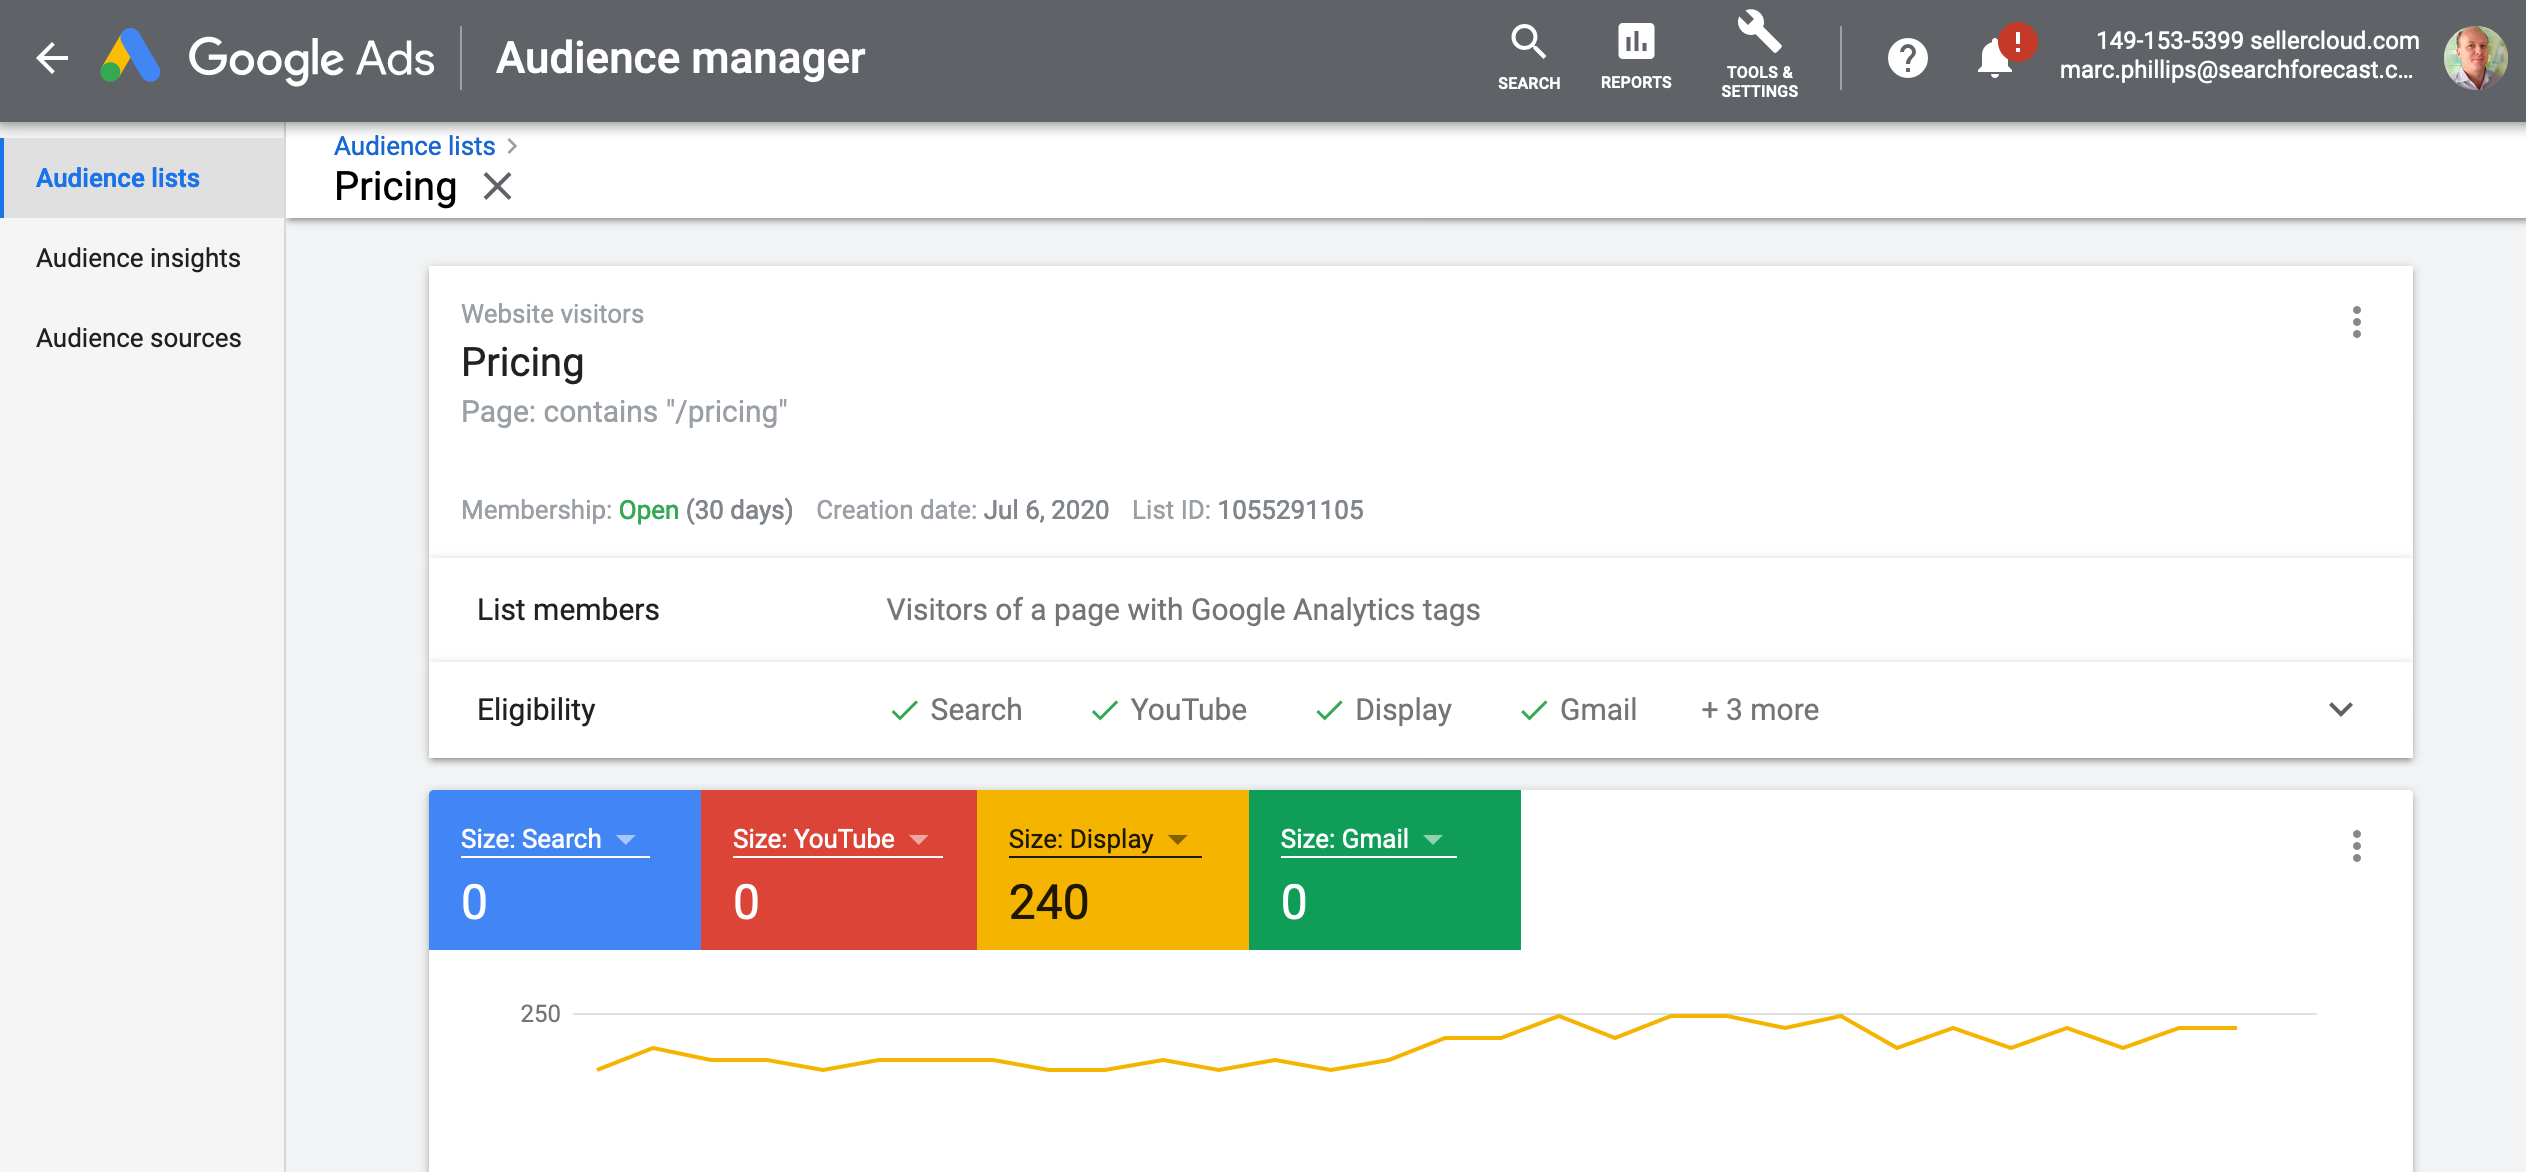
Now, inside Google Ads > Audience Manager, you can see the corresponding Audience as per below. See how the audience equals 240. It typically takes 30 days to build up a good audience that is big enough to start displaying ads to.

Screen Shot 2020-08-16 at 12.18.12 AM

This is a great way to create more targeted banner display ads for niche audiences across a client website instead of just targeting ads to “All Website Visitors”. Thanks Covid!


How Google Events enable Website Engagement Metrics

2019 has been a great year for technical webmasters and Google Analytics tech heads who want to show clients more engagement metrics. Using Google Tag Manager ‘tags’ (requires html scripting), it’s possible to show clients what ‘clicks’ are taking place on their website pages and go deeper into what elements on a page (buttons, links, images, etc) are being used by ‘users’ on each ‘page view’.

Clients like to know how many people are using their widgets like calculators, price search query tools, how many phone numbers are clicked on, forms submitted. They can then report on granular interactions across their website to management and stakeholders. One of our clients has 150 stores and this is some of the tags our skilled data scientists set up inside Google Tag Manager.Screen Shot 2019-09-14 at 8.21.08 PM


Using Google Tag Manager, it takes experienced developers who understand how to create tags and script them accordingly so they fire off the correct action and it is recorded inside Google Analytics.

gtm

Setting up Store Visits in Google Analytics

Right, good news for our retail clients…

Google is enabling “Store visits” reporting inside Google Analytics, which means users who comes from paid / organic via Google and then visit each physical store are recorded. So how do they do this?

…. “Store visits are estimates based on data from users who have turned on Location History”. That means, when a Google user has their location history turned on inside Google Maps (you can turn it off), Google will record a) website visit and b) store visit.

A small miracle in omni-channel marketing for retail businesses .

There’s one more catch… Google require you to have 90% of your retail stores with a Google My Business citation information up to date and that these are linked locations verified to Adwords accounts.

This is one of the reasons why setting up the Google Ad Campaigns by geo / retail store is so important and where lots of retail clients do not. By having 1 campaign for each store practice linked via a Location Extension to each corresponding Google My Business citation and then syncing the account, the activation for “Store visits”  reporting will appear.

Screen Shot 2019-05-16 at 9.22.25 PM

Google Analytics Spam ‘Vote for Trump’

Happy Halloween 2017!

On the back of Facebook announcing  that Russia-based operatives published about 80,000 posts on the social network over a two-year period in an effort to sway U.S. politics and that about 126 million Americans may have seen the posts during that time, we decided to audit our clients Google Analytics accounts to detect any foreign abnormal activities.

And look what we found in one of our client accounts under “Audience > Geo > Language”. Now that is VERY SCARY!

Screen Shot 2017-11-01 at 12.00.11 AM